Clinical Trial
. 2007 May 15;104(20):8496-501.
doi: 10.1073/pnas.0702495104. Epub 2007 May 4.

Triggering sleep slow waves by transcranial magnetic stimulation

Affiliations
Clinical Trial

Triggering sleep slow waves by transcranial magnetic stimulation

Marcello Massimini et al. Proc Natl Acad Sci U S A. .

Abstract

During much of sleep, cortical neurons undergo near-synchronous slow oscillation cycles in membrane potential, which give rise to the largest spontaneous waves observed in the normal electroencephalogram (EEG). Slow oscillations underlie characteristic features of the sleep EEG, such as slow waves and spindles. Here we show that, in sleeping subjects, slow waves and spindles can be triggered noninvasively and reliably by transcranial magnetic stimulation (TMS). With appropriate stimulation parameters, each TMS pulse at <1 Hz evokes an individual, high-amplitude slow wave that originates under the coil and spreads over the cortex. TMS triggering of slow waves reveals intrinsic bistability in thalamocortical networks during non-rapid eye movement sleep. Moreover, evoked slow waves lead to a deepening of sleep and to an increase in EEG slow-wave activity (0.5-4.5 Hz), which is thought to play a role in brain restoration and memory consolidation.


Conflict of interest statement

The authors declare no conflict of interest.

Figures

Fig. 1.
Fig. 1.
TMS during sleep triggers slow waves that resemble spontaneously occurring ones. (A Upper) The signal recorded from a channel (Cz) located under the stimulator during two TMS-ON blocks over a background of spontaneous NREM sleep (single-subject data). Each TMS-ON block consisted of 40 stimuli at ≈0.8 Hz. The stimulation site (hot spot) is marked by a red cross on the cortical surface. The red highlighted sections show the slow waves triggered at the beginning and at the end of one block. Spontaneously occurring slow waves recorded from the same subject a few minutes later are depicted in the blue highlighted section. (B) TMS-evoked and spontaneous slow waves, recorded from all channels, were detected based on period-amplitude criteria and averaged on the negative peak. TMS-evoked and spontaneous slow waves had similar shape. (C) The average signal recorded from Cz was band-pass filtered (0.25–4 Hz) in the top trace. In the middle and bottom traces the corresponding single trials were filtered in the spindles frequency range (12–15 Hz) and rectified (rms). The positive wave of the TMS-evoked slow wave was associated with an increase in spindle amplitude. (D) The delay gradient of the negative peak is shown for a single TMS-evoked slow wave (Upper) and for a single spontaneous slow wave (Lower). The red dot marks the location of the channel with delay = 0 (origin). The blue lines starting from the origin represent the streamlines calculated on the vector field of delays. TMS-evoked slow waves, like spontaneous ones, spread on the scalp as traveling waves. (E) The probability of each electrode being the origin of a traveling wave is shown for both TMS-evoked and spontaneous slow waves. TMS-evoked slow waves originated more frequently from the area underlying the stimulator. (F) TMS-evoked slow waves and auditory evoked K-complexes, recorded from all channels, were detected based on period-amplitude criteria and averaged. The value indicates the probability of evoking a slow wave with TMS and auditory stimulation at 0.8 Hz. Unlike TMS, auditory stimuli triggered slow waves unreliably and with an ≈300-ms delay.
Fig. 2.
Fig. 2.
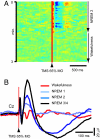
TMS triggering of slow waves is state-specific. (A) TMS-evoked single-trial responses during a transition from NREM sleep to wakefulness. MO, maximal stimulator output. Voltage is color-coded (red, positive; blue, negative). During NREM sleep, each TMS pulse triggered a slow wave (prominent negative deflection followed by a positive rebound). Awakening was associated with the sudden disappearance of the slow wave response, which was replaced by low-amplitude, fast-frequency components. (B) Average TMS-evoked potential recorded from Cz during different states of vigilance in a single subject. TMS evoked slow waves resembling high-amplitude spontaneous slow waves only during sleep stages 2, 3, and 4.
Fig. 3.
Fig. 3.
TMS triggering of slow waves is dose- and site-dependent. TMS was delivered at four midline sites along the posterior–anterior axis of the cortex (posterior parietal, sensorimotor, supplementary motor, and rostral premotor). The brain response to TMS was probed, at each site, at four increasing intensities (MO, maximum stimulator output). The average responses to 15 TMS trials recorded from all channels (referenced to the mastoid) is shown for each intensity and each cortical site (the data refer to an individual subject). The amplitude of the negative peak depended on stimulation intensity. However, the ability of TMS to trigger slow waves changed markedly along the posterior–anterior axis: High-amplitude slow waves could be elicited reliably only when stimulating sensorimotor cortex, whereas stimulation of more anterior cortical sites produced low-amplitude waves.
Fig. 4.
Fig. 4.
Cortical activation evoked by TMS. (A and A′) Averaged TMS-evoked potentials recorded at all electrodes, superimposed in a butterfly diagram for a low-amplitude wave triggered from premotor cortex (top) and for a high-amplitude wave triggered from sensorimotor cortex (bottom) during sleep. The channel located under the stimulator is plotted in red. (B and B′) The absolute current density in the cerebral cortex is estimated with L2 Norm at different time points and plotted together with the corresponding scalp voltage distribution (red, positive; blue, negative). (C and C′) The current density distribution is autoscaled and thresholded at 80% to highlight the location of maximum current sources. Whereas premotor stimulation gave rise to cortical currents that remained local, TMS in sensorimotor cortex triggered a large negative deflection associated with long-lasting currents that spread broadly to the surrounding cortex starting from a fixed local maximum. (A″C″) TMS delivered over sensorimotor cortex during wakefulness evoked a low-amplitude, complex wave shape associated with a spatially and temporally differentiated pattern of activation. Maximum cortical activation shifted over time among distant cortical areas giving rise to a long-range, specific response.
Fig. 5.
Fig. 5.
The triggering of slow waves by each TMS pulse led to a marked increase of SWA. (A) The signal recorded from a channel under the stimulator (upper trace) and the time course of SWA power (0.5–4.5 Hz, 4-s windows, average of all sensors) are depicted during a complete block design sequence for an individual subject. (B) The topography of SWA during the TMS-ON block and during the TMS-OFF block, and their ratio. (C) Spectral profiles (average of all sensors) recorded during the TMS-ON blocks (red) and the TMS-OFF blocks (black). The gray horizontal bars indicate the significant bins (P < 0.01). (D) Summary of individual data: single responses to TMS, recorded from a channel (Cz) during the block design, are plotted (Left) together with the topography of the increase in SWA induced by TMS. (E) Shown for each subject is the average SWA power recorded from all sensors during TMS-OFF (black bars) and TMS-ON (red bars) blocks.

References

    1. Steriade M, Nunez A, Amzica F. J Neurosci. 1993;13:3252–3265. - PMC - PubMed
    1. Steriade M, Timofeev I, Grenier F. J Neurophysiol. 2001;85:1969–1985. - PubMed
    1. Massimini M, Huber R, Ferrarelli F, Hill S, Tononi G. J Neurosci. 2004;24:6862–6870. - PMC - PubMed
    1. Sejnowski TJ, Destexhe A. Brain Res. 2000;886:208–223. - PubMed
    1. Steriade M, Timofeev I. Neuron. 2003;37:563–576. - PubMed

Publication types

LinkOut - more resources