. 2007 Oct;122(2):167-78.
doi: 10.1111/j.1365-2567.2007.02622.x. Epub 2007 May 2.

Dose-dependent modulation of CD8 and functional avidity as a result of peptide encounter

Affiliations

Dose-dependent modulation of CD8 and functional avidity as a result of peptide encounter

Charles J Kroger et al. Immunology. 2007 Oct.

Abstract

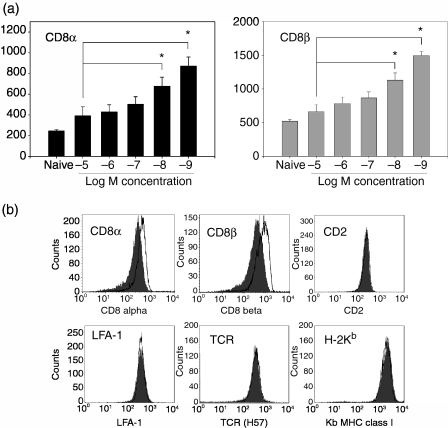
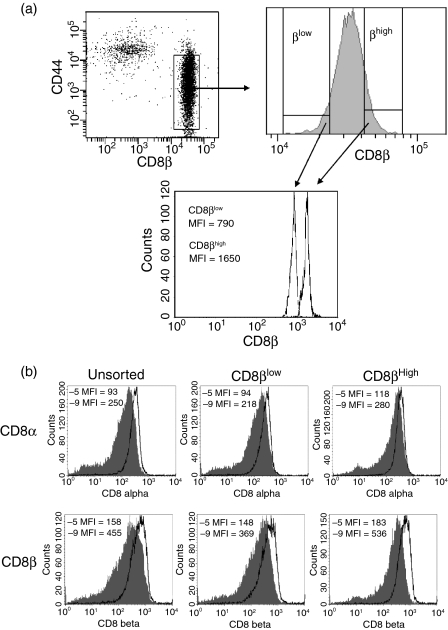
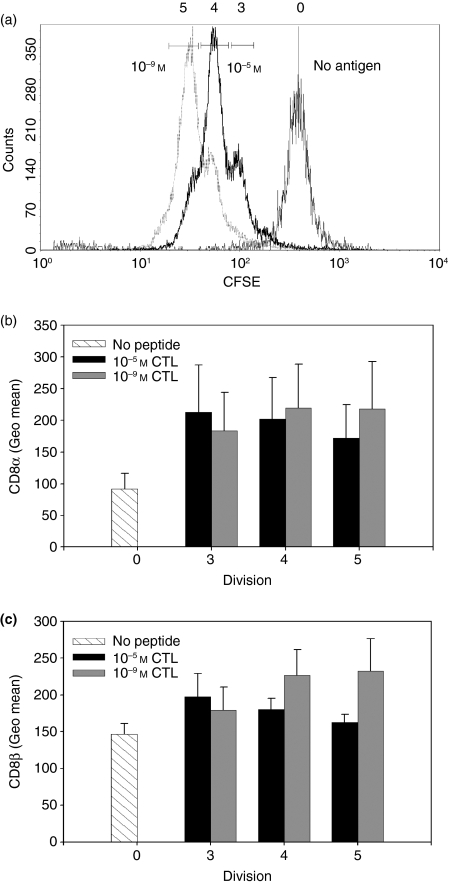
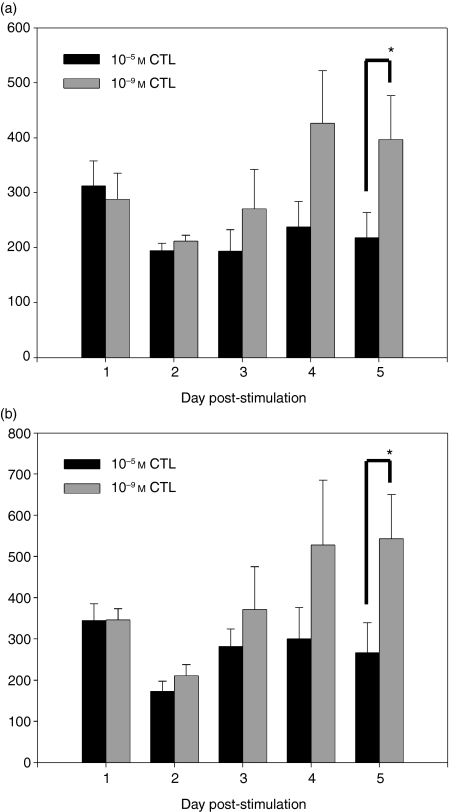
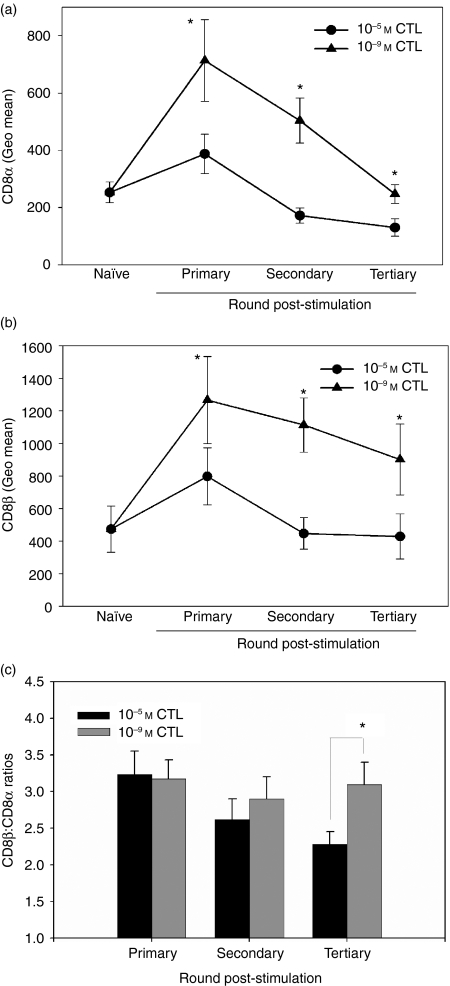
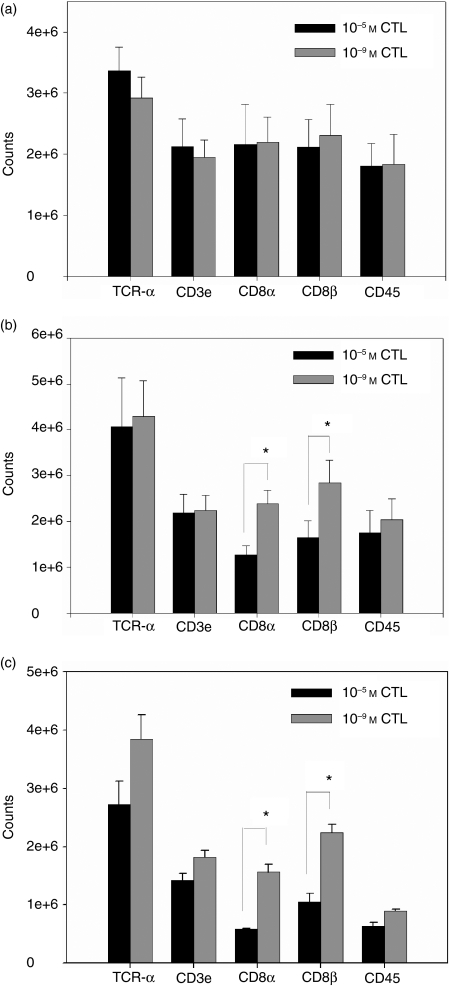
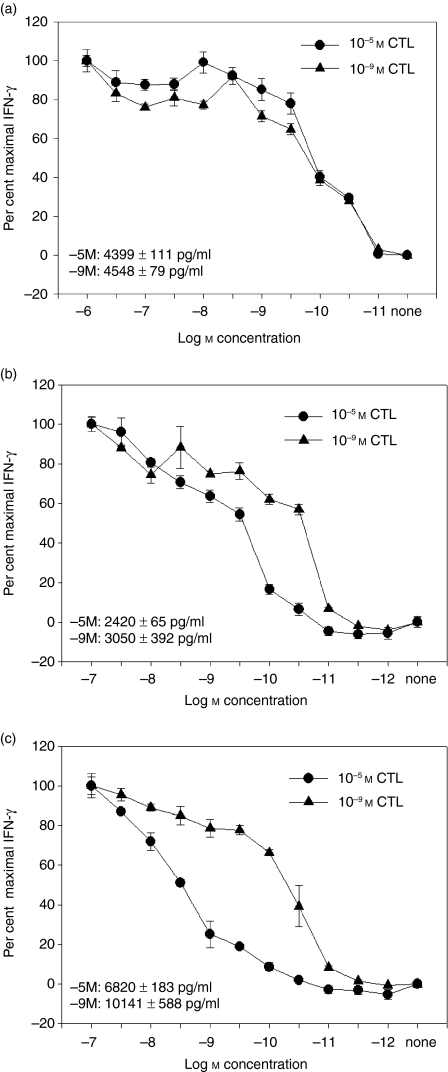
The generation of an optimal CD8(+) cytotoxic T lymphocyte (CTL) response is critical for the clearance of many intracellular pathogens. Previous studies suggest that one contributor to an optimal immune response is the presence of CD8(+) cells exhibiting high functional avidity. In this regard, CD8 expression has been shown to contribute to peptide sensitivity. Here, we investigated the ability of naive splenocytes to modulate CD8 expression according to the concentration of stimulatory peptide antigen. Our results showed that the level of CD8 expressed was inversely correlated with the amount of peptide used for the primary stimulation, with higher concentrations of antigen resulting in lower expression of both CD8alpha and CD8beta. Importantly the ensuing CD8(low) and CD8(high) CTL populations were not the result of the selective outgrowth of naive CD8(+) T-cell subpopulations expressing distinct levels of CD8. Subsequent encounter with peptide antigen resulted in continued modulation of both the absolute level and the isoform of CD8 expressed and in the functional avidity of the responding cells. We propose that CD8 cell surface expression is not a static property, but can be modulated to 'fine tune' the sensitivity of responding CTL to a defined concentration of antigen.


Figures

Figure 1
Figure 1
CD8 cell surface expression is modulated in a dose-dependent manner as a result of antigen encounter. Naive P14 TCR transgenic splenocytes were stimulated with C57BL/6 splenocytes pulsed with the indicated peptide concentrations. On day 7 post-stimulation the responding CTL were analysed for the cell surface expression of CD8α (black bars) and CD8β (grey bars) (a). The data shown are the average of at least three independently generated CTL lines. Representative histograms for the cell surface expression of CD8α, CD8β, CD2, LFA-1, H-2Kb, and TCR on P14 TCR transgenic splenocytes on day 7 post-stimulation with the high (10−5m) (dark grey shaded plot) or low (10−9m) (bold black line) concentration of antigen (b). *P < 0·05 on paired Student's t-test.
Figure 2
Figure 2
CD8 modulation on sorted CD8βlow or CD8βhigh naive P14 splenocytes following stimulation with a high versus low concentration of antigen. Naive P14 TCR transgenic splenocytes were costained with antibodies to CD44 and CD8β, and CD44low CD8βlow or CD44low CD8βhigh sorted cells. The gating strategy and recovered populations are shown in (a). The sorted cells were then split into two groups and stimulated with either the high (10−5m) (shaded histogram) or low (10−9m) (open histogram) concentration of antigen. An unsorted naive P14 TCR transgenic splenocyte sample was included as a control. Day 7 post-stimulation the cell surface expression of CD8α (upper panel) and CD8β (lower panel) was analysed (b). The geometric MFI for CD8 expression is indicated. The sort and post-sort analyses were performed using different instruments (FacsAria versus FacsCalibur). This accounts for the differences in the absolute MFI intensities in A compared with B. The data shown are representative of three experiments.
Figure 3
Figure 3
Dose-dependent modulation of CD8 cell surface expression was not evident during the initial rounds of proliferation. (a) Naive P14 TCR transgenic splenocytes labelled with CFSE were stimulated with Thy-1.1+ splenocytes with either unpulsed (thin black line) or pulsed with a high (10−5m) (bold black line) or low (10−9m) (grey dotted line) concentration of antigen. On day 2 post-stimulation, the cells were stained with αThy-1.2, αCD8α, and αCD8β antibodies and the cell surface expression of CD8α (b) and CD8β (c) was analysed on responding Thy-1.2+ CTL. The CD8α and CD8β expression on no antigen (stripped bars), 10−5m (black bars) or 10−9m (grey bars) stimulated cells in different rounds of proliferation is shown. The data shown are the average of three independent CTL lines.
Figure 4
Figure 4
Dose-dependent modulation of CD8 occurred following the initial proliferative burst. Naive P14 TCR transgenic splenocytes were stimulated with Thy-1.1+ splenocytes pulsed with a high (10−5m) (black bars) or low (10−9m) (grey bars) concentration of antigen. The expression of CD8α (a) and CD8β (b) was determined on Thy-1.2+ cells on the indicated days post-stimulation. *P < 0·05 as determined by paired Student's t-test. The data shown are the average of the data obtained from three independent CTL lines.
Figure 5
Figure 5
Differential modulation of CD8α and CD8β following multiple stimulations. The CD8α (a) and CD8β (b) expression level was examined on naive P14 splenocytes before their encounter with antigen and following primary, secondary and tertiary stimulation with a high or low concentration of antigen. The CD8β : CD8α ratio was calculated following each round of stimulation; it was determined by dividing the CD8β MFI by the CD8α MFI (c). The data in (a) to (c) are the average of at least five independently generated CTL lines. *P < 0·05 as determined by paired Student's t-test.
Figure 6
Figure 6
The steady-state mRNA levels of CD8α and CD8β following secondary and tertiary stimulation correlate with CD8 cell surface expression. RNA was isolated from 10−5m (black bars) and 10−9m (grey bars) CTL populations following primary (a), secondary (b), or tertiary (c) stimulation and a multiprobe RNase protection assay performed. The amount of RNA loaded between samples was determined by normalization to the RPA standard L32. At least three individual CD8low (10−5m) and CD8high (10−9m) CTL lines were analysed at each time-point. *P < 0·05 as determined by paired Student's t-test.
Figure 7
Figure 7
Differences in functional avidity are detected following repeated peptide stimulation. The functional avidity of responding CTL was examined day 7 post primary (a), secondary (b), or tertiary (c) stimulation with 10−5m or 10−9m peptide antigen. EL4 cells previously pulsed with the indicated antigen concentrations were cocultured with the CTL overnight and the quantity of IFN-γ produced was determined by enzyme-linked immunosorbent assay. The data in (a) to (c) are each representative of three independent experiments. The values in the inset box are the amount of IFN-γ (pg/ml) produced at the highest peptide concentration.

Similar articles

Cited by

References

    1. Alexander MA, Damico CA, Wieties KM, et al. Correlation between CD8 dependency and determinant density using peptide-induced, Ld-restricted cytotoxic T lymphocytes. J Exp Med. 1991;173:849–58. - PMC - PubMed
    1. Alexander-Miller MA, Leggatt GR, Berzofsky JA. Selective expansion of high- or low-avidity cytotoxic T lymphocytes and efficacy for adoptive immunotherapy. Proc Natl Acad Sci USA. 1996;93:4102–7. - PMC - PubMed
    1. Gallimore A, Dumrese T, Hengartner H, et al. Protective immunity does not correlate with the hierarchy of virus-specific cytotoxic T cell responses to naturally processed peptides. J Exp Med. 1998;187:1647–57. - PMC - PubMed
    1. Yee C, Savage PA, Lee PP, et al. Isolation of high avidity melanoma-reactive CTL from heterogeneous populations using peptide-MHC tetramers. J Immunol. 1999;162:2227–34. - PubMed
    1. Zeh HJ, III, Perry-Lalley D, Dudley ME, et al. High avidity CTLs for two self-antigens demonstrate superior in vitro and in vivo antitumor efficacy. J Immunol. 1999;162:989–94. - PubMed

Publication types