. 2007 May 7:7:43.
doi: 10.1186/1471-213X-7-43.

Quantitative analysis of Hedgehog gradient formation using an inducible expression system

Affiliations

Quantitative analysis of Hedgehog gradient formation using an inducible expression system

Vivian F Su et al. BMC Dev Biol. .

Abstract

Background: The Hedgehog (Hh) family of secreted growth factors are morphogens that act in development to direct growth and patterning. Mutations in human Hh and other Hh pathway components have been linked to human diseases. Analysis of Hh distribution during development indicates that cholesterol modification and receptor mediated endocytosis affect the range of Hh signaling and the cellular localization of Hh.

Results: We have used an inducible, cell type-specific expression system to characterize the three-dimensional distribution of newly synthesized, GFP-tagged Hh in the developing Drosophila wing. Following induction of Hh-GFP expression in posterior producing cells, punctate structures containing Hh-GFP were observed in the anterior target cells. The distance of these particles from the expressing cells was quantified to determine the shape of the Hh gradient at different time points following induction. The majority of cholesterol-modified Hh-GFP was found associated with cells near the anterior/posterior (A/P) boundary, which express high levels of Hh target genes. Without cholesterol, the Hh gradient was flatter, with a lower percentage of particles near the source and a greater maximum distance. Inhibition of Dynamin-dependent endocytosis blocked formation of intracellular Hh particles, but did not prevent movement of newly synthesized Hh to the apical or basolateral surfaces of target cells. In the absence of both cholesterol and endocytosis, Hh particles accumulated in the extracellular space. Staining for the Hh receptor Ptc revealed four categories of Hh particles: cytoplasmic with and without Ptc, and cell surface with and without Ptc. Interestingly, mainly cholesterol-modified Hh is detected in the cytoplasmic particles lacking Ptc.

Conclusion: We have developed a system to quantitatively analyze Hh distribution during gradient formation. We directly demonstrate that inhibition of Dynamin-dependent endocytosis is not required for movement of Hh across target cells, indicating that transcytosis is not required for Hh gradient formation. The localization of Hh in these cells suggests that Hh normally moves across both apical and basolateral regions of the target cells. We also conclude that cholesterol modification is required for formation of a specific subset of Hh particles that are both cytoplasmic and not associated with the receptor Ptc.


Figures

Figure 1
Figure 1
HhNp-GFP is functional. (A) Scheme of HhF-GFP (middle) and HhN-GFP (bottom) fusion constructs and predicted processing as compared to wild-type HhF (top). HhF-GFP is predicted to be processed into HhNp-GFP. (B-D) HhNp-GFP (green, C) is expressed in posterior cells labeled by fluorescent protein dsRed (red, D) and secreted (B), similar to wild-type HhNp (A/P boundary marked by a solid white line). Scale bar: 5 μm (E) Western blot of salivary gland protein extracts labeled with anti-GFP (upper panel) or tubulin (lower panel). Upper panel: as negative controls we used extracts of wild-type w1118 larvae (lane 1) and larvae expressing an untagged HhF (lane 5), CD8-GFP was used as a positive control (lane2). A single 46 kDa band is seen in the lane with HhN-GFP expressing larvae (lane 3) and in the lane loaded with extract of HhF-GFP expressing larvae, two bands of 70 kDa and 46 kDa are seen (lane 4; U: unprocessed full-length HhF-GFP, P: processed HhNp-GFP). Lower panel: the same blot was reprobed with anti-tubulin for loading control. (F-I) HhF expression in adult wings. (F) Wild-type wing. (G) Wing from HhF-GFP rescue of hhGS1 mutant has a similar phenotype to wild-type. (H) As a positive control, untagged HhF is expressed with 71B-Gal4 resulting in merged veins L2 and L3. (I) Ectopic expression of HhF-GFP has a similar phenotype to untagged HhF.
Figure 2
Figure 2
HhNp-GFP localizes at the membrane, in endocytic compartments, and extracellularly. (A-E) Localization of HhNp-GFP (green), expressed with Hh-Gal4, with FM4-64 (red, A-B), dextran (red, C-D), extracellular labeling with anti-GFP, and DCAD (red and blue, E). (B, D, E) Z-sections. HhNp-GFP (A') co-localizes with FM4-64 (A") at the membrane in the posterior (A/P boundary marked by the solid white line) as seen in the merge (A). Anterior HhNp-GFP appears in particles (arrows). Most of the particles localize apically (B). Many of the anterior HhNp-GFP particles co-localize (arrows in C-D) with dextran but some can be found without dextran (arrowheads in C-D). Incubation of anti-GFP in cold medium detects extracellular HhNp-GFP in the anterior apically in particles (arrows in E), and basolaterally both in particles (arrowheads in E) and with a membrane association (bracket in E). Scale bar: 8 μm
Figure 3
Figure 3
Schematic diagram of Gal4-Gal80 inducible expression system. (A) Inducing Hh-GFP expression. Vials are kept at 18°C, the Gal80 permissive temperature where tubulin-Gal80 blocks Gal4-mediated transcription. Upon a shift to 32°C, Gal80 repression is relieved and Gal4 transcription proceeds. Hh-GFP is expressed in the posterior cells with Hh-Gal4, and UAS-dsRed marks the expressing cells. (B) Inducing Hh-GFP expression in shits1 mutant background. Vials are kept at 18°C, the Gal80 permissive temperature and shits1 mutant restrictive temperature. Upon a shift to 32°C, Gal4 transcription proceeds while endocytosis is blocked. Wild-type Shi is expressed in the posterior to restore endocytosis in the expressing cells. The resulting Hh-GFP movement into the anterior would be due solely to shi independent mechanisms. Hh-Gal4 is used again to drive transgene expression.
Figure 4
Figure 4
Cholesterol restricts HhNp-GFP distribution but endocytosis is not required for distribution. (A-H) Induced expression of HhNp-GFP in wild-type (A-B) and shits1 background (C-D) and HhN-GFP in wild-type (E-F) and shits1 background (G-H). (A-H) 25 μm projections; (A'-H') 20 μm Z-section projections. At 8 hr, HhNp-GFP particles are found near the A/P boundary, marked by the solid white line (A, A'). After 24 hr, more particles can be found further away (B, B'). HhN-GFP particles are detected further from the A/P boundary than HhNp-GFP at both time points (E-F). When endocytosis is blocked, HhNp-GFP particles are still detected in anterior cells (C-D). In wild-type and shits1 backgrounds, HhNp-GFP particles appear closer to the apical side (A'-D') as well as HhN-GFP in wild-type. When endocytosis is blocked, HhN-GFP moves into the anterior but there is reduced punctate staining and more membrane accumulation (G-H), primarily on the apical side of cells (G'-H'). Scale bar: 5 μm
Figure 5
Figure 5
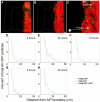
Quantitative analysis of Hh-GFP distribution: Cholesterol is required to restrict distribution but endocytosis is not required for distribution. (A-C) Schematic illustration of quantitative analysis. (A) Three dimensional reconstruction of a confocal z-stack with Hh-GFP (green) and dsRed (red) marking the expressing cells. (B) Generation of isosurfaces. DsRed isosurfacing was used to generate a distance map used to measure distances of Hh-GFP particles. Hh-GFP particles were isosurfaced to identify particles using an intensity threshold and size criteria. (C) Depiction of particle distance measurements. Particles were measured for the shortest distance to the expressing cells (lines depict manual measurements but all measurements were calculated in an automated fashion). Scale bar: 5 μm. (D-F) Mean of normalized HhNp-GFP (green) versus HhN-GFP (red) distribution profiles in a wild-type background. All samples were normalized to generate percentages of particles at the distances. Normalized data was then averaged to generate distribution profiles. Enlargement of the distribution near the x-axis shows more HhN-GFP is detected further from the A/P boundary (0 on the x-axis) at 8 (D; HhNp-GFP n = 5, HhN-GFP n = 4) and 24 hr (E; HhNp-GFP n = 16, HhN-GFP n = 7). The same is seen at 72 hr (F; HhNp-GFP n = 5, HhN-GFP n = 6). (G-H) Mean of normalized HhNp-GFP distribution profiles in wild-type background (green) versus shits1 mutant background (blue). At 8 (G; shits1 n = 4) and 24 hr (H; shits1 n = 7), HhNp-GFP in the mutant background is less restricted and found further away from the A/P boundary than in the wild-type background. The same HhNp-GFP distribution profiles in the wild-type background from D and E are used for G and H, respectively.
Figure 6
Figure 6
Non-Ptc containing Hh-GFP particles require cholesterol but not endocytosis. (A-C) Ptc co-localization with HhNp-GFP (A), HhN-GFP (B), and HhNp-GFP in the shits1 background (C) after expression induced for 8 hr. (A-C) Hh-GFP (green) labeled with Phalloidin (purple). (A'-C') Hh-GFP (green) labeled with Ptc (red). (A''-C'') Hh-GFP only. (A'''-C''') Ptc only. 4 classes of HhNp-GFP particles are seen: non-Phalloidin associated (cytoplasmic) with Ptc (white arrow), non-Phalloidin associated (cytoplasmic) without Ptc (white arrowhead), Phalloidin (membrane) associated with Ptc (yellow arrow), Phalloidin (membrane) associated without Ptc (yellow arrowhead). Most HhNp-GFP particles are membrane-associated and do not contain Ptc, but cytoplasmic particles have a relatively even distribution with and without Ptc. More HhN-GFP also localizes with Phalloidin, and almost all cytoplasmic HhN-GFP particles contain Ptc. HhNp-GFP particles in shits1 mutant background are Phalloidin-associated and many do not contain Ptc. The A/P boundary is marked by a solid white line. Scale bar: 5 μm.

Similar articles

Cited by

References

    1. Ingham PW, McMahon AP. Hedgehog signaling in animal development: paradigms and principles. Genes Dev. 2001;15:3059–3087. doi: 10.1101/gad.938601. - DOI - PubMed
    1. Heemskerk J, DiNardo S. Drosophila hedgehog acts as a morphogen in cellular patterning. Cell. 1994;76:449–460. doi: 10.1016/0092-8674(94)90110-4. - DOI - PubMed
    1. Strigini M, Cohen SM. A Hedgehog activity gradient contributes to AP axial patterning of the Drosophila wing. Development. 1997;124:4697–4705. - PubMed
    1. Hooper JE, Scott MP. Communicating with Hedgehogs. Nat Rev Mol Cell Biol. 2005;6:306–317. doi: 10.1038/nrm1612. - DOI - PubMed
    1. Tabata T, Takei Y. Morphogens, their identification and regulation. Development. 2004;131:703–712. doi: 10.1242/dev.01043. - DOI - PubMed

Publication types

MeSH terms

LinkOut - more resources