Review
. 2007 May;20(5):539-51.
doi: 10.1016/j.echo.2006.10.013.

Left ventricular form and function revisited: applied translational science to cardiovascular ultrasound imaging

Affiliations
Review

Left ventricular form and function revisited: applied translational science to cardiovascular ultrasound imaging

Partho P Sengupta et al. J Am Soc Echocardiogr. 2007 May.

Abstract

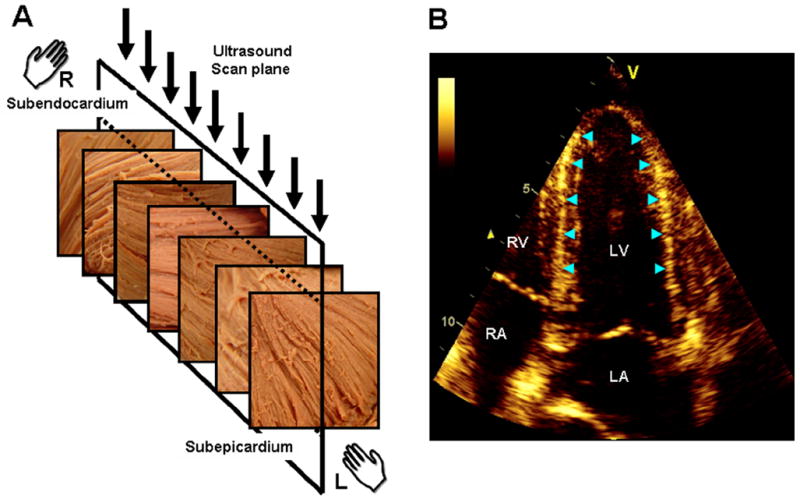
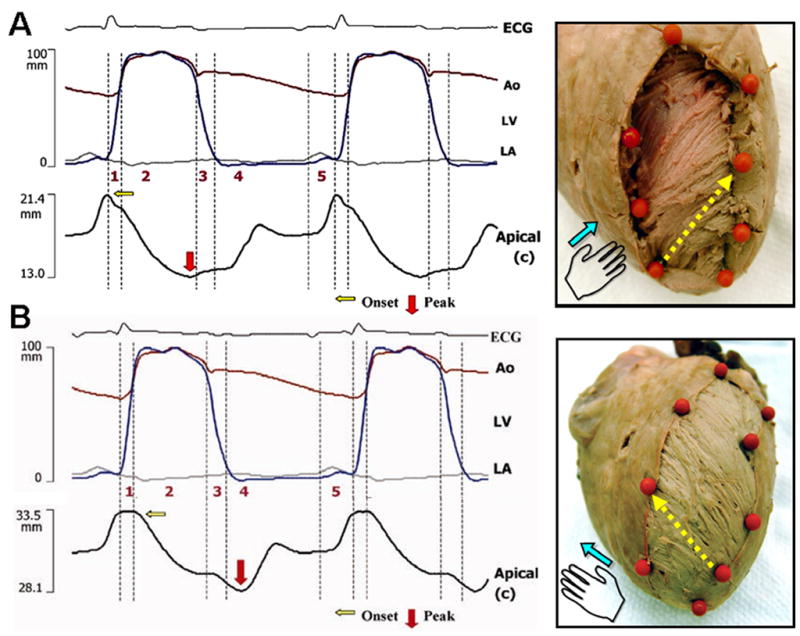
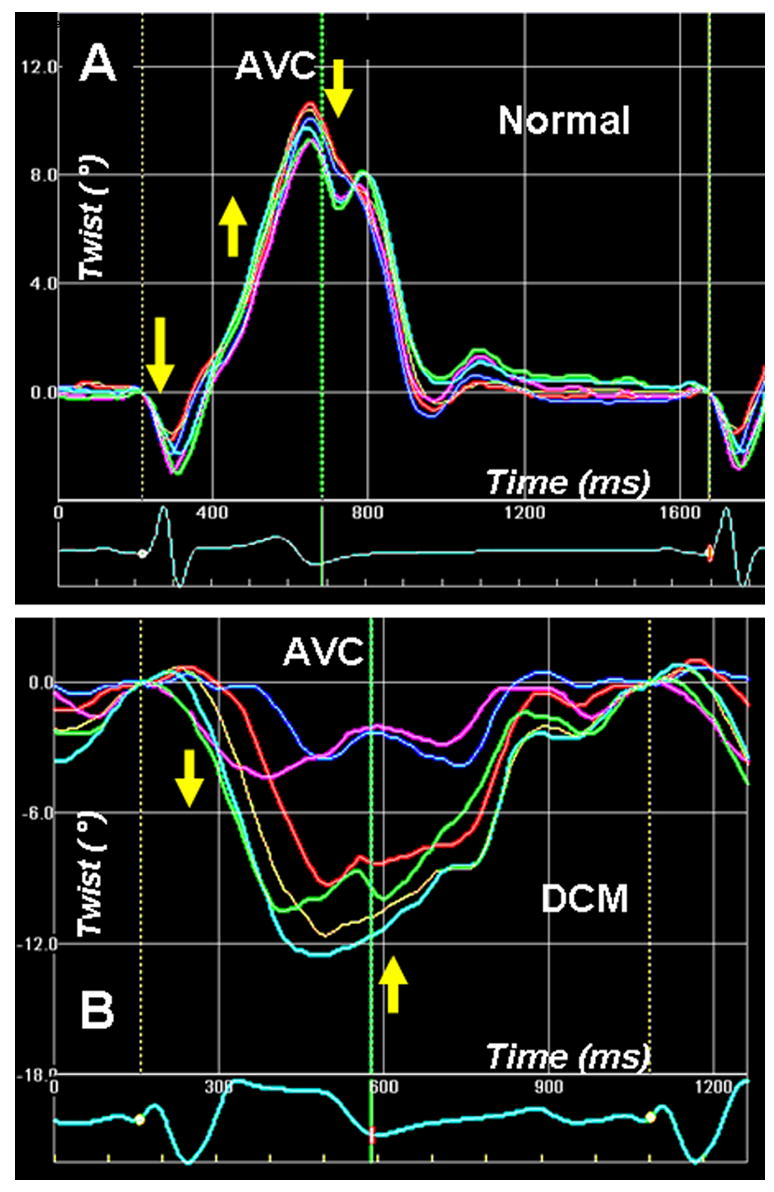
Doppler tissue imaging (DTI) and DTI-derived strain imaging are robust physiologic tools used for the noninvasive assessment of regional myocardial function. As a result of high temporal and spatial resolution, regional function can be assessed for each phase of the cardiac cycle and within the transmural layers of the myocardial wall. Newer techniques that measure myocardial motion by speckle tracking in gray-scale images have overcome the angle dependence of DTI strain, allowing for measurement of 2-dimensional strain and cardiac rotation. DTI, DTI strain, and speckle tracking may provide unique information that deciphers the deformation sequence of complexly oriented myofibers in the left ventricular wall. The data are, however, limited. This review examines the structure and function of the left ventricle relative to the potential clinical application of DTI and speckle tracking in assessing the global mechanical sequence of the left ventricle in vivo.


Figures

Figure 1
Figure 1
Anatomy of a vortex. Two fluorescent dyes identify the counterdirectional swirls in a vortex: inner descending (red) and outer ascending (green) swirls (A, reproduced from (4) with permission). The longitudinal view (B) of the two counterdirectional swirls (red, descending; blue, ascending) is compared with the end on view from the surface of the vortex (C). There is a striking similarity between a vortex and the clockwise descending and counterclockwise ascending loops of myofibers in the LV (D, reproduced from (5) with permission). Fibers in the LV resemble a state of ‘locked vortex’. The subendocardial region follows a geometric configuration of right-handed helix, while subepicardial fibers are in form of a left-handed helix (E). The right-handed helical arrangement of the subendocardial region can also be identified in the arrangement of trabeculae in the LV (F). L, left handed; R, right handed; 1, subendocardial fibers; 2, papillary muscle; 3, vortex cordis; 4, circumferential fibers; 5, subepicardial fibers
Figure 2
Figure 2
Illustration of the link between the transmural variation of myocardial fiber direction (A) and the speckle pattern generated in echocardiography (B) (adapted from (34)). The fiber direction changes from a right-handed helix in the subendocardium to a left-handed helix in the subepicardium. The direction of myofibers is predominantly circumferential in the midwall. The ultrasonic image plane in apical 4-chamber view (A, arrows) is, therefore, orthogonal to the circumferentially oriented fibers in the midwall. The region of LV wall where fibers are orthogonal to the plane of ultrasound produce bright speckles and can be readily identified in the septum and lateral wall of the LV (B, arrow heads). LV, left ventricle; LA, left atrium; RV, right ventricle; RA, right atrium
Figure 3
Figure 3
Transmural sequence of deformation in the left ventricle using sonomicrometry. During isovolumic contraction, shortening is initiated along the subendocardial (right-handed helical) fiber direction (A). Onset of shortening in the subepicardial (left-handed helical) fiber direction is delayed and coincides with the onset of left ventricular ejection (B). The tissue specimens on the right show the corresponding subendocardial and subepicardial fiber arrangements, the position of sonomicrometry crystals (orange markers), and pairs of crystals used to determine deformation along the fiber direction (yellow arrows). Phase 1, preejection; 2, ejection; 3, isovolumic relaxation; 4, early diastole; 5, late diastole. Ao, aorta (red tracing); ECG, electrocardiogram; LA, left atrium (gray tracing); LV, left ventricle (blue tracing).
Figure 4
Figure 4
Left ventricular apex rotation (twist) measured by 2-D speckle tracking of B-mode ultrasound images (2D strain) in a normal individual (A). An initial clockwise rotation occurs during the preejection period, followed by counterclockwise twisting during the ejection phase. Clockwise untwisting occurs predominantly during the phase of isovolumic relaxation. The adjoining panel (B) shows apical twist in a patient with dilated cardiomyopathy with dysfunctional apex. The apical twist sequence is completely the reverse of normal, i.e. apex rotates in clockwise direction during ejection, and in counterclockwise direction in diastole. Phases 1–5 are described in Fig. 3 legend.
Figure 5
Figure 5
Direct in vivo imaging of anterior wall of a beating porcine left ventricle using high-resolution linear array transducer (10 mHz). Panel A shows anatomic M-mode imaging of the different layers of anterior segment of left ventricular apex at high temporal resolution (250 frames/sec). During isovolumic contraction, there is onset of motion of the endocardium towards the cavity (black arrows) and a reciprocal outward motion of the subepicardium (blue arrows). These reciprocal movements of the subendocardial and subepicardial regions are distinct on tracking movement of speckles at different depths of myocardial wall (panel B). Displacement of the subendocardial region shows an inward movement (red), whereas the subepicardial region shows an outward movement (blue) during the isovolumic period of the cardiac cycle. Phases 1–5 are described in Figure 3 legend.
Figure 6
Figure 6
Apex-to-base gradient of longitudinal deformation in the lateral wall of the left ventricle (LV)obtained by 2-D speckle tracking of B-mode ultrasound images (2-D strain) in a healthy adult female. Onset of longitudinal shortening occurs in the apical segment (panel A, red) and is delayed for the basal segment (Panel A, blue) of the LV. During ejection, shortening strains at the apex are higher than that at the base. Shortening-lengthening cross-over of the basal segment is delayed till the end of isovolumic relaxation Panel B shows the region of speckle tracking in lateral wall of the LV. Panel C shows the color M-mode profile of the longitudinal strains obtained from basal, mid and apical segments. Note the delayed onset of longitudinal shortening in the basal segment (arrow). The presence of blue color indicates presence of prestretching, while the apical and mid regions have already started shortening. Phases 1–5 in panel A are described in Figure 3 legend. ECG, electrocardiogram
Figure 7
Figure 7
Apex-to-base longitudinal displacement of the left ventricle (LV) measured by 2-D speckle tracking of B-mode ultrasound images (2 D strain) in normal (A) and a patient with dilated cardiomyopathy (also shown in Figure 4). In normal healthy individual, the LV base descends towards the apex and there is base-to-apex gradient of longitudinal displacement. Note that the descent of the LV base towards the apex is associated with higher longitudinal shortening strains from the LV apex (Figure 4). The longitudinal strain gradient is reversed in patient with dilated cardiomyopathy (figure 4). This is associated with paradoxical longitudinal ascent of the LV base in systole. Phases 1–5 are described in Fig. 6 legend.
Figure 8
Figure 8
Left ventricular flow during phases of cardiac cycle. M-mode characteristics of left ventricular intracavitary flow has been obtained with anatomical M-mode obtained along the long axis of the LV cavity during contrast infusion (A). Time-related changes in intracardiac flow in 2-dimension has been obtained by using high–temporal resolution 2D imaging at 200–250 frames/s and echo contrast particle imaging velocimetry (B). High frame rates allow tracking of bubbles sufficiently to determine the 2D component of local vectors of blood motion before the bubbles move out of the scan plane. For each phase, the local ensemble-averaged axis-normal velocity magnitude is superimposed on the vector field. 1, Isovolumic contraction. 2, Ejection. 3, Isovolumic relaxation. 4, Early diastole. 5, Late diastole. LA, left atrium; LV, left ventricle

Similar articles

Cited by

References

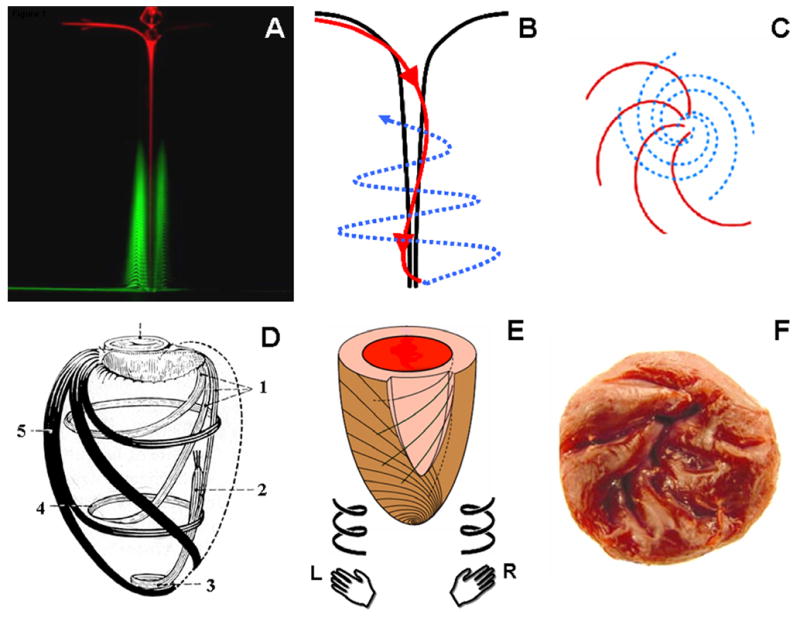
    1. Klar AJ. Fibonacci’s flowers. Nature. 2002;417:595. - PubMed
    1. Wurman J, Straka JM, Rasmussen EN. Fine-Scale Doppler Radar Observations of Tornadoes. Science. 1996;272:1774–7. - PubMed
    1. Lin CC. Global spiral patterns in galaxies: complexity and simplicity. Ann N Y Acad Sci. 1998;867:229–52. - PubMed
    1. Andersen A, Bohr T, Stenum B, Rasmussen JJ, Lautrup B. Anatomy of a bathtub vortex. Phys Rev Lett. 2003;91:104502. - PubMed
    1. Holdrege C. The Heart: A Pulsing and Perceptive Center. In: Holdrege C, editor. The Dynamic Heart and Circulation. Fair Oaks, CA: AWSNA Publications; 2002. p. 8.

Publication types

MeSH terms