3D mapping of language networks in clinical and pre-clinical Alzheimer's disease
- PMID: 17485107
- PMCID: PMC2211373
- DOI: 10.1016/j.bandl.2007.03.008
3D mapping of language networks in clinical and pre-clinical Alzheimer's disease
Abstract
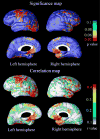
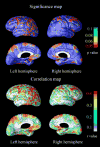
We investigated the associations between Boston naming and the animal fluency tests and cortical atrophy in 19 probable AD and 5 multiple domain amnestic mild cognitive impairment patients who later converted to AD. We applied a surface-based computational anatomy technique to MRI scans of the brain and then used linear regression models to detect associations between animal fluency and Boston Naming Test (BNT) performance and cortical atrophy. The global permutation-corrected significance for the maps associating BNT performance with cortical atrophy was p=.0124 for the left and p=.0196 for the right hemisphere and for the animal fluency maps p=.055 for the left and p=.073 for the right hemisphere. The degree of language impairment correlated with cortical atrophy in the left temporal and parietal lobes (BA 20, 21, 37, 39, 40, and 7), bilateral frontal lobes (BA 8, 9, and 44) and the right temporal pole (BA 38). Using a novel 3D mapping technique, we demonstrated that in AD language abilities are strongly influenced by the integrity of the perisylvian cortical regions.
Figures


References
-
- Apostolova LG, Lu PH, Rogers S, Dutton RA, Hayashi KM, Toga AW, Cummings JL, Thompson PM. 3D mapping of mini-mental state examination performance in clinical and preclinical Alzheimer disease. Alzheimer Dis Assoc Disord. 2006;20:224–31. - PubMed
-
- Ashburner J, Friston KJ. Voxel-based morphometry--the methods. Neuroimage. 2000;11:805–21. - PubMed
-
- Ballmaier M, O’Brien JT, Burton EJ, Thompson PM, Rex DE, Narr KL, McKeith IG, DeLuca H, Toga AW. Comparing gray matter loss profiles between dementia with Lewy bodies and Alzheimer’s disease using cortical pattern matching: diagnosis and gender effects. Neuroimage. 2004;23:325–35. - PubMed
-
- Ballmaier M, Sowell ER, Thompson PM, Kumar A, Narr KL, Lavretsky H, Welcome SE, DeLuca H, Toga AW. Mapping brain size and cortical gray matter changes in elderly depression. Biological Psychiatry. 2004;55:382–9. - PubMed
Publication types
MeSH terms
Grants and funding
LinkOut - more resources
Full Text Sources
Medical

