. 2007 Jul;27(14):5135-46.
doi: 10.1128/MCB.02282-06. Epub 2007 May 7.

c-Myc transforms human mammary epithelial cells through repression of the Wnt inhibitors DKK1 and SFRP1

Affiliations

c-Myc transforms human mammary epithelial cells through repression of the Wnt inhibitors DKK1 and SFRP1

Victoria H Cowling et al. Mol Cell Biol. 2007 Jul.

Abstract

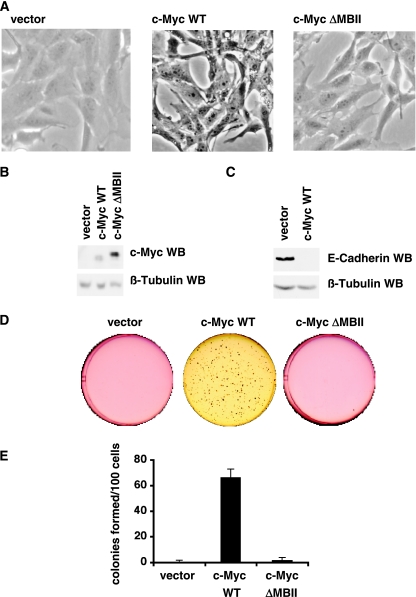
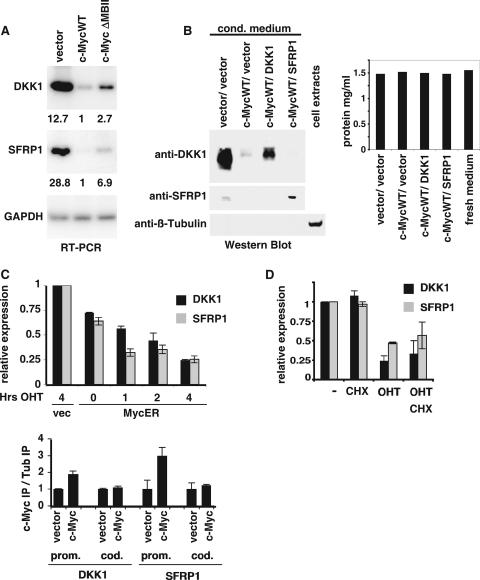
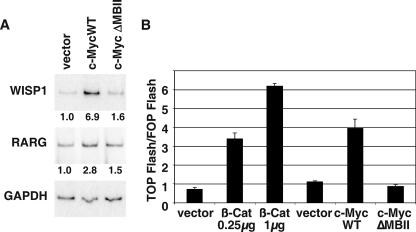
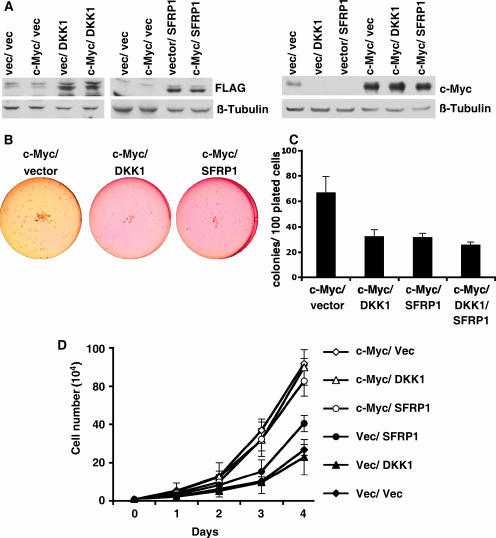
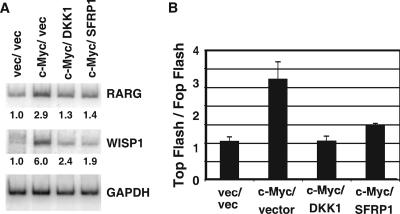
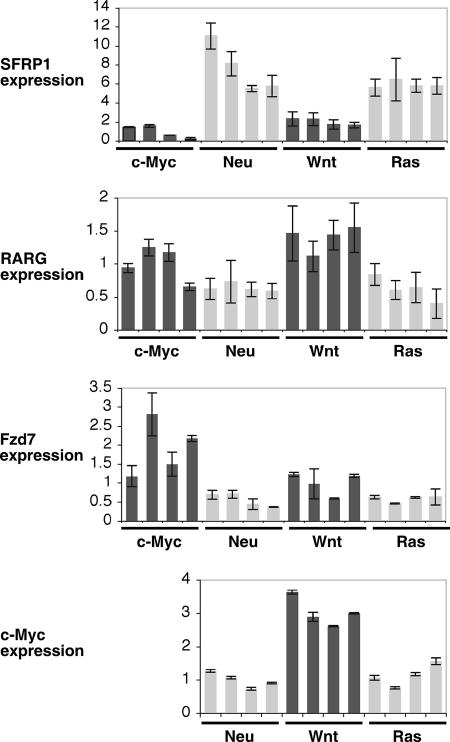
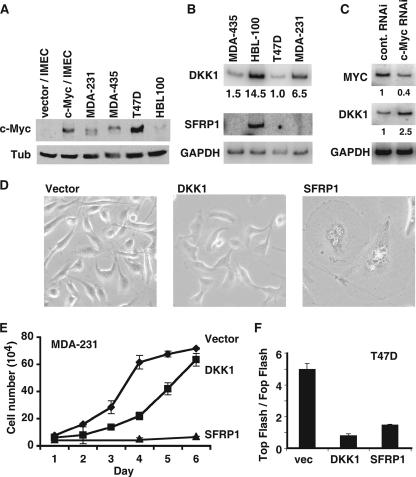
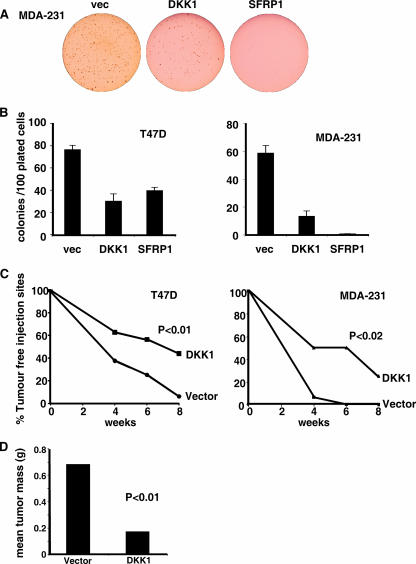
c-myc is frequently amplified in breast cancer; however, the mechanism of myc-induced mammary epithelial cell transformation has not been defined. We show that c-Myc induces a profound morphological transformation in human mammary epithelial cells and anchorage-independent growth. c-Myc suppresses the Wnt inhibitors DKK1 and SFRP1, and derepression of DKK1 or SFRP1 reduces Myc-dependent transforming activity. Myc-dependent repression of DKK1 and SFRP1 is accompanied by Wnt target gene activation and endogenous T-cell factor activity. Myc-induced mouse mammary tumors have repressed SFRP1 and increased expression of Wnt target genes. DKK1 and SFRP1 inhibit the transformed phenotype of breast cancer cell lines, and DKK1 inhibits tumor formation. We propose a positive feedback loop for activation of the c-myc and Wnt pathways in breast cancer.


Figures

FIG. 1.
FIG. 1.
c-Myc transforms TERT-IMECs. TERT-IMECs were infected with c-MycWT, c-MycΔMBII, or vector control, and pools were selected with hygromycin. (A) Phase-contrast micrographs of log-phase IMECs. (B) Western blot analyses were performed with equivalent amounts of cell extracts using anti-c-Myc antibody (top) and anti-β-tubulin antibody (bottom). (C) Western blot analyses were performed as for panel B with anti-E-cadherin antibody (top) and an anti-β-tubulin antibody (bottom). (D) Cell lines were subjected to a 14-day soft agar assay in six-well plates, and representative wells were scanned. (E) Colonies larger than 10 μm were counted for two wells from two independent experiments. The graph shows the mean number of colonies per 100 plated cells, and error bars indicate standard deviations.
FIG. 2.
FIG. 2.
c-Myc represses DKK1 and SFRP1. (A) RNA from IMECs expressing vector control, c-MycWT, or c-MycΔMBII (left) were used as a template for RT-PCR using primers specific for DKK1, SFRP1, and GAPDH. The RT-PCR signal was quantitated and normalized to c-MycWT values, and the relative values are shown below the image. (B) Immunoblotting was performed with equivalent volumes of conditioned medium from IMECs expressing the indicated constructs. Primary antibodies were anti-DKK1, anti-SFRP1, and anti-β-tubulin, as indicated. For the anti-β-tubulin blot, whole-cell extracts were used as a positive control. The protein concentration in the medium was determined by the Lowry method. (C) IMECs expressing vector control or c-MycER were induced with 100 nM OHT for 0, 1, 2, and 4 h, as indicated. RNA was extracted and used as a template for RT-PCR using primers specific for DKK1 (dark gray) and SFRP1 (light gray). (D) Human BJ fibroblasts expressing vector control or MycER were treated for 4 h with OHT and/or cycloheximide (CHX), as indicated. RNA was extracted and used as a template for RT-PCR using primers specific for DKK1, SFRP1, and GAPDH. Expression of DKK1 and SFRP1 normalized to GAPDH and relative to untreated cells is indicated. Throughout the figure, error bars indicate standard deviations. (E) ChIP assay performed on vector IMECs and c-Myc IMECs (left) using anti-c-Myc and anti-β-tubulin antibodies. PCR was performed using primers specific for the DKK1 and SFRP1 promoter (prom.) and coding (cod.) regions. PCR signals were normalized to input, and a ratio of signal from anti-Myc IP to anti-β-tubulin IP was calculated.
FIG. 3.
FIG. 3.
c-Myc activates Wnt signaling. (A) RNA extracted from IMECs expressing vector, c-MycWT, or c-MycΔMBII was used as a substrate for RT-PCR performed using primers specific for WISP1, RARG, and GAPDH. (B) TOP FLASH TCF reporter assay was performed with IMECs expressing vector control, c-Myc, or β-catenin, as described in Materials and Methods.
FIG. 4.
FIG. 4.
c-Myc repression of DKK1 and SFRP1 is necessary for c-Myc-induced transformation. c-MycWT IMECs and vector control IMECs were infected with DKK1-FLAG, FLAG-SFRP1, or empty vector (IRES-NEO), as indicated, and pools were selected. (A) Western blot analyses were performed with equivalent amounts of cell extracts using anti-FLAG antibody to detect DKK1 and SFRP1 and using anti-Myc antibody. Anti-β-tubulin served as a loading control. Cells were subjected to a 14-day soft agar assay in six-well plates. (B) Scan of representative wells. (C) Colonies larger than 10 μm were counted for two wells from two independent experiments. The graph shows the mean number of colonies per 100 plated cells, and error bars indicate standard deviations. (D) Cell proliferation rate of cell lines measured by counting equivalently plated cells on five consecutive days with a hemocytometer. The graph shows the mean cell number for each day for three independent experiments, and error bars show standard deviations. Each of the c-Myc-expressing cell lines proliferated significantly faster than all the vector control cells lines (vector, DKK1, and SFRP1), with P values of >0.03.
FIG. 5.
FIG. 5.
c-Myc repression of DKK1 or SFRP1 is necessary for c-Myc induction of Wnt/TCF targets. (A) RNA extracted from IMECs expressing both control vectors (LXSH and IRES-NEO), c-Myc/IRES-NEO, c-Myc/DKK1, and c-Myc/SFRP1 was used as a template for RT-PCR using primers specific for WISP1, RARG, and GAPDH. Bands were quantitated and normalized to those of vector control IMECs, indicated under the graphs. (B) The same cell lines were used for the TOP FLASH TCF reporter assay, as described in Materials and Methods.
FIG. 6.
FIG. 6.
SFRP1 expression is significantly lower in mouse mammary tumors induced by Myc than in those induced by Ras, Wnt, or Neu. RNA was extracted from four independent tumors induced in each of the following mice: MMTV-rtTA/TetO-MYC, MMTV-rtTA/TetO-Neu, MMTV-rtTA/TetO-Wnt, MMTV-rtTA/TetO-Ras. RT-PCR was performed using primers specific for SFRP1 and the Wnt target genes RARG, Fzd7, and c-Myc, as indicated. Error bars indicate standard deviations.
FIG. 7.
FIG. 7.
DKK1 and SFRP1 are repressed in breast cancer cell lines. (A)Western blot analyses were performed with equivalent amounts of cell extracts from three breast cancer cell lines, MDA-435, T47D, and MDA-231, and one normal breast epithelial cell line, HBL100, using anti-c-Myc antibody (top) and anti-β-tubulin antibody (Tub) (bottom). (B) RNA extracted from the same cell lines was used as a template for RT-PCR using primers specific for DKK1, SFRP1, and GAPDH. The RT-PCR signal was normalized to T47D for DKK1, and the relative values are shown below the blot. For SFRP1, the RT-PCR signal was detectable only in HBL100 cells, and so no relative quantitation was possible. (C) T47D cells were transfected with control or Myc-directed siRNA for 2 days. RNA was extracted, and RT-PCR was performed with primers for MYC, DKK1, and GAPDH. (D) Cell proliferation rate of the MDA-231 lines was measured by counting equivalently plated cells on six consecutive days with a hemocytometer. The graph shows the mean cell number for each day for two experiments, and error bars show standard deviations. (E) Phase-contrast micrographs of MDA-231 cells infected with vector control, DKK1, or SFRP1. (F) The TOP FLASH TCF reporter assay was performed on T47D cell lines transduced with vector, DKK1, or SFRP1, as indicated in Materials and Methods.
FIG. 8.
FIG. 8.
SFRP1 and DKK1 suppress transformation of human breast cancer cells. (A) MDA-231 cells expressing vector (vec), DKK1, and SFRP1. Cell lines were subject to a 14-day soft agar assay in six-well plates, and representative wells from the MDA-231 experiment are shown. (B) MDA-231 and T47D cells transduced with the indicated vector were plated in soft agar, and colonies larger than 10 μm were counted for two wells from two independent experiments. The graph shows the mean number of colonies per 100 plated cells, and error bars indicate standard deviations. (C) Nude mice were injected subcutaneously with MDA-231 vector or MDA-231 DKK cells, T47D vector cells, or T47D DKK cells. Injection sites were monitored, and the percentage of tumor-free injection sites is presented. (D) After 8 weeks, MDA-231 tumors were removed and weighed. Mean tumor masses are shown. (P values are shown in the figure.)

Similar articles

Cited by

References

    1. Assoian, R. K. 1997. Anchorage-dependent cell cycle progression. J. Cell Biol. 136:1-4. - PMC - PubMed
    1. Bafico, A., A. Gazit, T. Pramila, P. W. Finch, A. Yaniv, and S. A. Aaronson. 1999. Interaction of frizzled related protein (FRP) with Wnt ligands and the frizzled receptor suggests alternative mechanisms for FRP inhibition of Wnt signaling. J. Biol. Chem. 274:16180-16187. - PubMed
    1. Bafico, A., G. Liu, L. Goldin, V. Harris, and S. A. Aaronson. 2004. An autocrine mechanism for constitutive Wnt pathway activation in human cancer cells. Cancer Cell 6:497-506. - PubMed
    1. Baylin, S. B., and J. E. Ohm. 2006. Epigenetic gene silencing in cancer—a mechanism for early oncogenic pathway addiction? Nat. Rev. Cancer 6:107-116. - PubMed
    1. Bejsovec, A. 2005. Wnt pathway activation: new relations and locations. Cell 120:11-14. - PubMed

Publication types

LinkOut - more resources