Comparative Study
. 2007 May 14;204(5):1167-79.
doi: 10.1084/jem.20062079. Epub 2007 May 7.

CCR7 ligands control basal T cell motility within lymph node slices in a phosphoinositide 3-kinase-independent manner

Affiliations
Comparative Study

CCR7 ligands control basal T cell motility within lymph node slices in a phosphoinositide 3-kinase-independent manner

François Asperti-Boursin et al. J Exp Med. .

Abstract

The molecular mechanisms responsible for the sustained basal motility of T cells within lymph nodes (LNs) remain elusive. To study T cell motility in a LN environment, we have developed a new experimental system based on slices of LNs that allows the assessment of T cell trafficking after adoptive transfer or direct addition of T cells to the slice. Using this experimental system, we show that T cell motility is highly sensitive to pertussis toxin and strongly depends on CCR7 and its ligands. Our results also demonstrate that, despite its established role in myeloid cell locomotion, phosphoinositide 3-kinase (PI3K) activity does not contribute to the exploratory behavior of the T lymphocytes within LN slices. Likewise, although PI3K activation is detectable in chemokine-treated T cells, PI3K plays only a minor role in T cell polarization and migration in vitro. Collectively, our results suggest that the common amplification system that, in other cells, facilitates large phosphatidylinositol 3,4,5-trisphosphate increases at the plasma membrane is absent in T cells. We conclude that T cell motility within LNs is not an intrinsic property of T lymphocytes but is driven in a PI3K-independent manner by the lymphoid chemokine-rich environment.


Figures

Figure 1.
Figure 1.
Absence of PIP3 gradients in motile T cells. (A) Human PBT cells were cotransfected with AKT-PH-CFP and YFP and were either left unstimulated or stimulated with anti-CD3/CD28–coated beads, as indicated by an asterisk. (right) The ratio of PH-CFP/YFP is shown as a pseudocolored image. Bar, 5 μm. (B) Ratiometric measurement of PIP3 in representative migrating T cells. The same conditions as in A were used, except that T cells were plated on ICAM-1–coated coverslips and stimulated with 100 ng/ml of soluble CCL19. A time-lapse animation of this cell is shown in Video 1. Bar, 5 μm. Data in A and B are representative of three experiments. (C) Quantification of AKT-PH enrichment to the cell periphery in unstimulated (Ctl), anti-CD3/CD28–stimulated, and CCL19-stimulated cells migrating on ICAM-1. Data are the means ± SD of 18–34 cells per condition in three independent experiments. ***, P < 0.001. (D) AKT phosphorylation triggered by soluble CCL19. PBT cells were stimulated as in A, fixed, stained with anti–P-AKT (Ser473), and analyzed by flow cytometry. The y axis corresponds to the number of T cells. Unstained T cells are represented in red, and stained T cells are represented in blue. Video 1 is available at http://www.jem.org/cgi/content/full/jem.20062079/DC1.
Figure 2.
Figure 2.
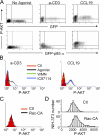
Absence of a Rac- and class Ia PI3K–dependent PIP3 amplification system in T lymphocytes. (A) Human PBT cells transfected with EGFP or EGFP-p85α were left unstimulated or stimulated with either soluble 10 μg/ml anti-CD3 for 15 min or 100 ng/ml CCL19 for 2 min, fixed, stained with anti–P-AKT, and analyzed by flow cytometry. (B) PBT cells were preincubated in the presence of medium alone, 100 nM WMN for 30 min, or IC87114 for 30 min, and were stimulated with either anti-CD3 or CCL19, stained, and analyzed as in A. Results are representative of three independent experiments. The y axis corresponds to the number of T cells. (C) PBT cells were transfected with vector alone or vector encoding a constitutively active (CA) form of Rac. P-AKT was detected by flow cytometry as in Fig. 1 B. The y axis corresponds to the number of T cells. (D) NIH-3T3 fibroblasts were transfected with vector alone or vector encoding a constitutively active (CA) form of Rac. P-AKT was detected on adherent cells by immunofluorescence.
Figure 3.
Figure 3.
PIP3 does not have an instructive role in F-actin assembly. (A) Human PBT cells were cotransfected with EGFP and either empty vector or p110-CAAX. P-AKT levels in GFP-positive cells were detected by flow cytometry. Empty vector-transfected cells were stimulated with 100 ng/ml CCL19 for 2 min to compare the magnitude of P-AKT induced by physiological activation with that induced by the expression of p110-CAAX. (B) The same conditions as in A were used, except that TRITC-conjugated phalloidin was used to stain F-actin. Data are representative of three independent experiments. The y axis corresponds to the number of T cells. (C) NIH-3T3 fibroblasts were transfected with vector alone or vector encoding p110-CAAX. F-actin was detected on adherent cells by immunofluorescence. (D) PBT cells cotransfected with EGFP-AKT-PH and either empty vector (Ctl) or p110-CAAX were left unstimulated (−) or stimulated (+) in suspension with 100 ng/ml CCL19 for 2 min, fixed, and stained with Texas red–conjugated phalloidin. Images show one representative cell for each condition.
Figure 4.
Figure 4.
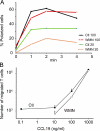
PI3K Activity is not essential for T cell polarization or migration in vitro. (A) PBT cells preincubated with 100 nM WMN for 30 min or medium alone were stimulated with CCL19 (20 and 100 ng/ml), and cell polarization was video recorded for 4 min. Quantification of one representative experiment is shown. (B) Transwell assay performed with control (Ctl) or WMN-treated PBTs. Data are representative of three experiments, and error bars represent the SD of duplicate samples.
Figure 5.
Figure 5.
T cells are highly motile within LN slices. (A) Fluorescently labeled T cells (CMFDA; green) and B cells (fura-2; red) were added to a LN slice 1 h before the recording. This image is the maximum projection of four images spanning 40 μm in the z direction beneath the cut surface of the slice. (B) Fluorescent T cells (CMFDA; green) were added to the LN slice. Resident B cells were subsequently labeled with a B-specific antibody (B220; red). The image was captured as in A. (C) Individual trajectories of T cells in the outer paracortex region of a LN slice depicted in x–y views during a 20-min recording. Tracks are color coded to indicate time progression from the beginning (blue) to the end (yellow) of imaging. The black line follows the edge of the node, whereas the dashed oval delimits the B cell zone. Video 2 represents time-lapse animation of these cells. (D) T cell velocity profile within a LN slice whose tracks are represented in C. The average speed is indicated with an arrow. (E) The linear relation between net displacement (average of 850 cells whose tracks are represented in C) and square root of time is compatible with random individual displacements. Video 2 is available at http://www.jem.org/cgi/content/full/jem.20062079/DC1.
Figure 6.
Figure 6.
T cells display antigen-independent Ca2+ increases within LN slices. (A) Ca2+ responses and motility in four representative T cells within a LN slice. T cells were loaded with fura-2 and added to a LN slice 30 min before the recording. (top) The sequential positions of migrating T cells (blue dots) at successive 20-s intervals. Ca2+ spikes are indicated by circled red dots. Bar, 10 μm. (bottom) The simultaneous measurement of Ca2+ level (red) and instantaneous (black) velocities plotted against time for the above tracked cells. Arrowheads indicate where a track starts. A time-lapse animation of the leftmost cell is shown in Video 3. (B)Relation between instantaneous velocity and Ca2+ levels. Dots are average Ca2+ values corresponding to velocities binned every 2 μm min−1. Data are from 11 cells. (C) Percentage of Ca2+-responding cells measured in two distinct areas of the LN slice, the cortical ridge (CR) and the deeper T zone (DTZ). Data are the means ± SD from four independent experiments in which >50 cells were analyzed per experiment. The inset schematizes the positions, in a LN, of the CR and the DTZ in relation to a B follicle (B) and the medulla (M). Video 3 is available at http://www.jem.org/cgi/content/full/jem.20062079/DC1.
Figure 7.
Figure 7.
T cell recruitment and migration within LN slices are inhibitable by PTX. (A) Image of control T cells treated with the inactive B subunit of PTX (green) and PTX-treated T cells (red) in a LN slice. T cells were incubated for 2 h with 100 ng/ml suB or PTX, respectively labeled with CMFDA or fura-2 and overlaid on a LN slice. The dashed line delimits the B cell zone. (B) Tracks of individual suB-treated (green) and PTX-treated (red) T cells from one slice over a period of 20 min. Video 4 represents time-lapse animation of these cells. (C and D) Velocities and motility coefficients of suB- and PTX-treated T cells within LN slices. T cells were incubated for 10 min with 100 ng/ml suB or PTX, washed, labeled with two different fluorescent dyes, and overlaid on a LN slice. T cell behavior was analyzed 3 h after the initial toxin treatment. Results in C and D represent the mean and SD calculated from six independent experiments in which >100 cells were analyzed per experiment. *, P < 0.05. Video 4 is available at http://www.jem.org/cgi/content/full/jem.20062079/DC1.
Figure 8.
Figure 8.
T cell motility within the LN slice depends on the CCR7 ligands. (A) Quantification of cells found 10 μm below the surface of the slice in a 50-μm2 zone. Cells were automatically counted in three dimensions with Imaris software. Cells were treated for 2 h with 100 ng/ml suB or PTX, washed, labeled with fluorescent dyes, and overlaid on a LN slice of WT and plt mice. Slices were treated or not with 5 μg/ml AMD3100 that selectively inhibits the CXCL12–CXCR4 interaction. Data give the mean of three experiments ± SD. (B) Fluorescently labeled T cells (CMFDA; green) and CCR7-deficient T cells (fura-2; red) were added to a LN slice 1 h before the recording. In the zoomed image (inset) of the outlined region, tracks of WT (green) and CCR7-deficient (red) T cells are represented over a period of 20 min. The dashed line delimits the subcapsular sinus (SC) region from the T cell zone. The white line indicates the edge of the LN. Video 5 represents time-lapse animation of these cells. (C and D) Velocities and motility coefficients of T cells that have been overlaid on WT or plt slices. Where indicated, slices were treated with 10 μg/ml AMD3100 during the recording. (E and F) Velocities and motility coefficients of WT and CCR7-deficient T cells that have been overlaid on WT slices 1 h before the recording. Slices were treated where indicated with AMD3100 as in C and D. Shown are means ± SD of at least five independent experiments in which >100 cells were analyzed per experiment. **, P < 0.01; ***, P < 0.001. Video 5 is available at http://www.jem.org/cgi/content/full/jem.20062079/DC1.
Figure 9.
Figure 9.
PI3K Activity is not essential for T cell motility within LN slices. T cells were incubated with 100 nM WMN for 30 min and labeled with CMFDA (red), whereas control (Ctl) cells were labeled with fura-2 (green). Cells were overlaid on a LN slice (A, B, and C) or adoptively transferred (D, E, and F). 1 h after cell plating or 2 h after adoptive transfer, T cell motility was analyzed in the T zones of LN slices. (A and D) Tracks of individual Ctl and WMN-treated cells added to a slice (A) or after adoptive transfer (D) during a 20-min recording. The outlined region in D shows the accumulation of WMN-treated T cells in restricted areas of the LN slice after adoptive transfer. Videos 6 and 7 represent time-lapse animations of cells in A and D, respectively. (B, C, E, and F) Velocities and motility coefficients of Ctl and WMN-treated cells added to a slice (B and C) or after adoptive transfer (E and F). Data are the means ± SD of at least five independent experiments in which >100 cells were analyzed per experiment. Videos 6 and 7 are available at http://www.jem.org/cgi/content/full/jem.20062079/DC1.

Similar articles

Cited by

References

    1. Gunn, M.D., K. Tangemann, C. Tam, J.G. Cyster, S.D. Rosen, and L.T. Williams. 1998. A chemokine expressed in lymphoid high endothelial venules promotes the adhesion and chemotaxis of naive T lymphocytes. Proc. Natl. Acad. Sci. USA. 95:258–263. - PMC - PubMed
    1. Cyster, J.G. 2005. Chemokines, sphingosine-1-phosphate, and cell migration in secondary lymphoid organs. Annu. Rev. Immunol. 23:127–159. - PubMed
    1. Nakano, H., S. Mori, H. Yonekawa, H. Nariuchi, A. Matsuzawa, and T. Kakiuchi. 1998. A novel mutant gene involved in T-lymphocyte-specific homing into peripheral lymphoid organs on mouse chromosome 4. Blood. 91:2886–2895. - PubMed
    1. Forster, R., A. Schubel, D. Breitfeld, E. Kremmer, I. Renner-Muller, E. Wolf, and M. Lipp. 1999. CCR7 coordinates the primary immune response by establishing functional microenvironments in secondary lymphoid organs. Cell. 99:23–33. - PubMed
    1. Bousso, P., and E. Robey. 2003. Dynamics of CD8+ T cell priming by dendritic cells in intact lymph nodes. Nat. Immunol. 4:579–585. - PubMed

Publication types

MeSH terms