Comparative Study
. 2007 May 14;204(5):1131-44.
doi: 10.1084/jem.20062342. Epub 2007 May 7.

The length of lipids bound to human CD1d molecules modulates the affinity of NKT cell TCR and the threshold of NKT cell activation

Affiliations
Comparative Study

The length of lipids bound to human CD1d molecules modulates the affinity of NKT cell TCR and the threshold of NKT cell activation

Corinna McCarthy et al. J Exp Med. .

Abstract

CD1d-restricted lymphocytes recognize a broad lipid range. However, how CD1d-restricted lymphocytes translate T cell receptor (TCR) recognition of lipids with similar group heads into distinct biological responses remains unclear. Using a soluble invariant NKT (iNKT) TCR and a newly engineered antibody specific for alpha-galactosylceramide (alpha-GalCer)-human CD1d (hCD1d) complexes, we measured the affinity of binding of iNKT TCR to hCD1d molecules loaded with a panel of alpha-GalCer analogues and assessed the rate of dissociation of alpha-GalCer and alpha-GalCer analogues from hCD1d molecules. We extended this analysis by studying iNKT cell synapse formation and iNKT cell activation by the same panel of alpha-GalCer analogues. Our results indicate the unique role of the lipid chain occupying the hCD1d F' channel in modulating TCR binding affinity to hCD1d-lipid complexes, the formation of stable immunological synapse, and cell activation. These data are consistent with previously described conformational changes between empty and loaded hCD1d molecules (Koch, M., V.S. Stronge, D. Shepherd, S.D. Gadola, B. Mathew, G. Ritter, A.R. Fersht, G.S. Besra, R.R. Schmidt, E.Y. Jones, and V. Cerundolo. 2005. Nat. Immunol 6:819-826), suggesting that incomplete occupation of the hCD1d F' channel results in conformational differences at the TCR recognition surface. This indirect effect provides a general mechanism by which lipid-specific lymphocytes are capable of recognizing both the group head and the length of lipid antigens, ensuring greater specificity of antigen recognition.


Figures

Figure 1.
Figure 1.
Glycolipids used in this study. The lengths of acyl and phytosphingosine chains are indicated.
Figure 2.
Figure 2.
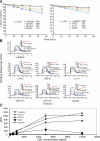
Affinity and kinetics of GSL binding to hCD1d and iNKT TCR binding to the hCD1d–GSL complex. (A) Dissociation of GSL from hCD1d. The indicated hCD1d–GSL complex was loaded onto a sensor surface at t = 0, and the amount of hCD1d remaining at the indicated time point was measured using Fab 9B. (B) Affinity and kinetics of iNKT TCR binding to hCD1d complexed with α-GalCer (top), C20:0, C20:2, and C11:1 (middle), and OCH15, OCH12, and OCH9 (bottom). Increasing concentrations from 0.4 to 194 μM (twofold dilution) of iNKT TCR were injected for 5 s over the indicated hCD1d–GSL complexes. The binding responses of five concentrations are shown superimposed. The insets show binding response at equilibrium. A representative experiment is shown. (C) C1R-hCD1d cells were pulsed with the GSLs shown and were stained with the biotinylated tetramerized iNKT TCR. Mean channel fluorescence (MCF) as determined by FACS is shown to vary with the TCR affinity as measured by SPR studies. A representative experiment out of three is shown.
Figure 3.
Figure 3.
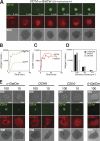
Kinetics and threshold of human iNKT cell synapse formation. (A) Time lapse of the interaction of an iNKT cell with an artificial lipid bilayer loaded with hCD1d–α-GalCer antigen at a density of 200 molecules/μm2 (green) and ICAM-1 at a density of 80 molecules/μm2 (red) as visualized by confocal microscopy. Contacts of the iNKT cell with the bilayer were visualized by IRM (grayscale, bottom). (B and C) The amount of hCD1d–ligand (B) and ICAM-1 (C) aggregated were quantified as a function of time for hCD1d–α-GalCer (closed circles) and hCD1d–OCH9 (open circles). All of the data is representative of at least 20 cells in three independent experiments. Loading of lipid bilayers with either hCD1d–α-GalCer or hCD1d–OCH9 monomers was normalized using Fab 9B, confirming a similar proportion of hCD1d monomers containing α-GalCer and OCH9 within the duration of each experiment. (D) The amount of antigen aggregated was quantified for the different ligands and densities as a function of time. ICAM-1 accumulation levels were equivalent in all of the cases (not depicted). (E) Synapse formation for the indicated ligands (α-GalCer, OCH9, C20:0, and β-GalCer) displayed at varying densities (top number in molecules/μm2) in the presence of ICAM-1 (density = 80 molecules/μm2) as visualized by confocal microscopy. A representative single cell after 30 min of interaction with the bilayer is shown in each column. Bars, 5 μm.
Figure 4.
Figure 4.
Calcium influx in response to the CD1d–ligands. (A) Kinetics of calcium influx of iNKT cells in contact with bilayers loaded with hCD1d–α-GalCer (top) or hCD1d–OCH9 (bottom) at a density of 200 molecules/μm2 in the presence of ICAM-1 (density = 80 molecules/μm2) as visualized by confocal microscopy. Fluorescence is shown in a pseudocolor scale. (B) The amount of intracellular calcium influx in fluorescence units (arbitrary units [AU]) for α-GalCer (closed circles) and OCH9 (open circles) quantified over a period of 10 min. Bars, 5 μm.
Figure 5.
Figure 5.
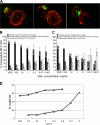
α-GalCer is efficient in inducing the polarization of iNKT cell granules at the immunological synapse. (A) The confocal images show iNKT cells conjugated with C1R-hCD1d cells pulsed with 1 μM α-GalCer. Lytic granules are stained with anti–cathepsin D (green) and both target and effector cells stained with antitubulin (red). Upon target cell recognition, lytic granules move from the rear of the cell (left), around the nucleus (middle), and polarize at the immunological synapse (right). (B and C) Quantitative analysis of granule polarization in iNKT cells recognizing C1R-hCD1d cells pulsed with α-GalCer (B) or OCH9 lipids (C). Cell conjugates with granules at the rear (white bars), granules moving laterally toward the synapse (gray bars), and granules at the synapse (black bars) were counted using a fluorescence microscope. (D) iNKT-dependent lysis of DCs pulsed with either α-GalCer or OCH9. Human monocyte-derived DCs were incubated with a human iNKT line at a ratio of 1:1 in the presence of different concentrations of α-GalCer (open triangles) or OCH9 (filled squares). After 24 h, DC viability was evaluated by FACS analysis gating on propidium iodide–negative cells. Error bars represent SD.
Figure 6.
Figure 6.
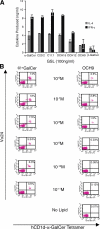
iNKT cell expansion and activation in vitro is modulated by the length of GSL sphyngosine chain. (A) CIR-hCD1d cells were pulsed with shown GSL and used to stimulate human iNKT cells. Supernatant was assayed for IL-4 (gray bars) or IFN-γ (black bars) by ELISA. SD from the mean (error bars) of two duplicate assays is shown. (B) iNKT cell frequency (Vα24+hCD1d-tetramer+ cells as the percentage of gated cells) on day 21 after stimulation of PBLs with mature autologous DCs pulsed with either α-GalCer or OCH9 at varying concentrations. Experiments were performed three times using three different healthy donors. The results of a representative experiment are shown.
Figure 7.
Figure 7.
Modeling of the effects of variation in lipid chain length on the hCD1d structure. In both panels, a Cα trace and selected side chains are shown for the hCD1d crystal structure with bound α-GalCer (yellow), and relevant regions of the structure of hCD1d in the absence of bound ligand are shown in green. Hydrogen bonds are depicted as dotted lines. The putative position of bound TCR is indicated schematically. (A) The portion of α-GalCer in the crystal structure of hCD1d–α-GalCer, which corresponds to OCH9, is drawn in blue. Some side chains are positioned differently in the empty compared with α-GalCer–filled structure. Based on those differences, we have highlighted the residues that are predicted to move when OCH9 occupies the F′ channel as compared with their position in the α-GalCer–filled F′ channel. (B) The portion of α-GalCer that corresponds to a ligand with a shortened acyl chain (C11:1) is highlighted in blue. We have highlighted the side chains that are predicted to shift position based on a comparison of the empty and fully occupied (i.e., α-GalCer bound) hCD1d A′ channel.

References

    1. Brigl, M., and M.B. Brenner. 2004. CD1: antigen presentation and T cell function. Annu. Rev. Immunol. 22:817–890. - PubMed
    1. Brutkiewicz, R.R. 2006. CD1d ligands: the good, the bad, and the ugly. J. Immunol. 177:769–775. - PubMed
    1. Kinjo, Y., E. Tupin, D. Wu, M. Fujio, R. Garcia-Navarro, M.R. Benhnia, D.M. Zajonc, G. Ben-Menachem, G.D. Ainge, G.F. Painter, et al. 2006. Natural killer T cells recognize diacylglycerol antigens from pathogenic bacteria. Nat. Immunol. 7:978–986. - PubMed
    1. Koch, M., V.S. Stronge, D. Shepherd, S.D. Gadola, B. Mathew, G. Ritter, A.R. Fersht, G.S. Besra, R.R. Schmidt, E.Y. Jones, and V. Cerundolo. 2005. The crystal structure of human CD1d with and without alpha-galactosylceramide. Nat. Immunol. 6:819–826. - PubMed
    1. Zeng, Z., A.R. Castano, B.W. Segelke, E.A. Stura, P.A. Peterson, and I.A. Wilson. 1997. Crystal structure of mouse CD1: an MHC-like fold with a large hydrophobic binding groove. Science. 277:339–345. - PubMed

Publication types