. 2007 Oct 18;26(48):6863-74.
doi: 10.1038/sj.onc.1210497. Epub 2007 May 7.

p400 function is required for the adenovirus E1A-mediated suppression of EGFR and tumour cell killing

Affiliations

p400 function is required for the adenovirus E1A-mediated suppression of EGFR and tumour cell killing

M B Flinterman et al. Oncogene. .

Abstract

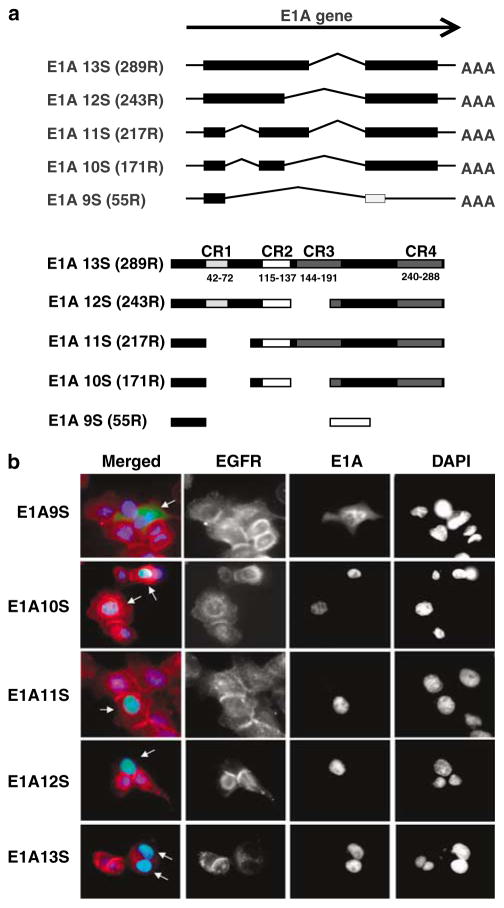
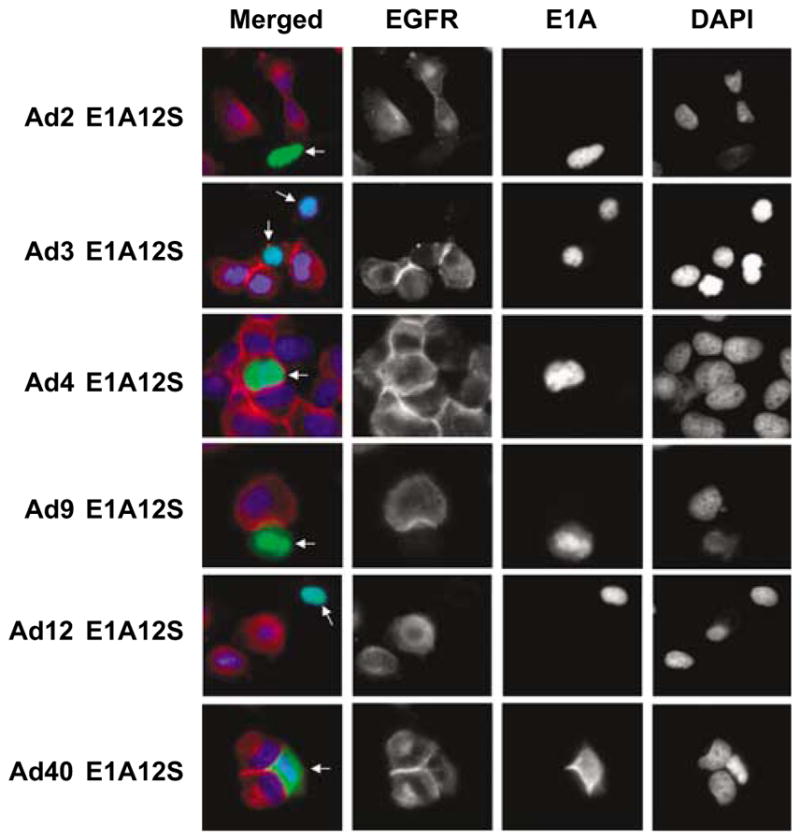
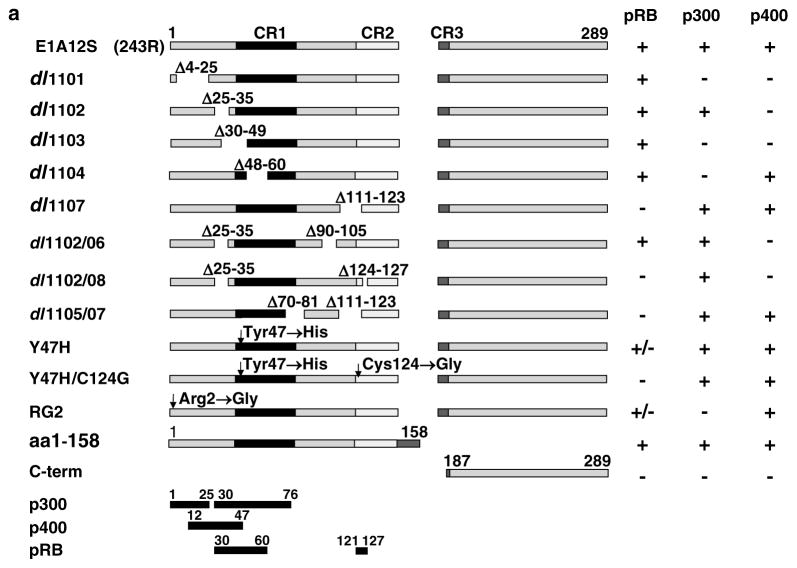
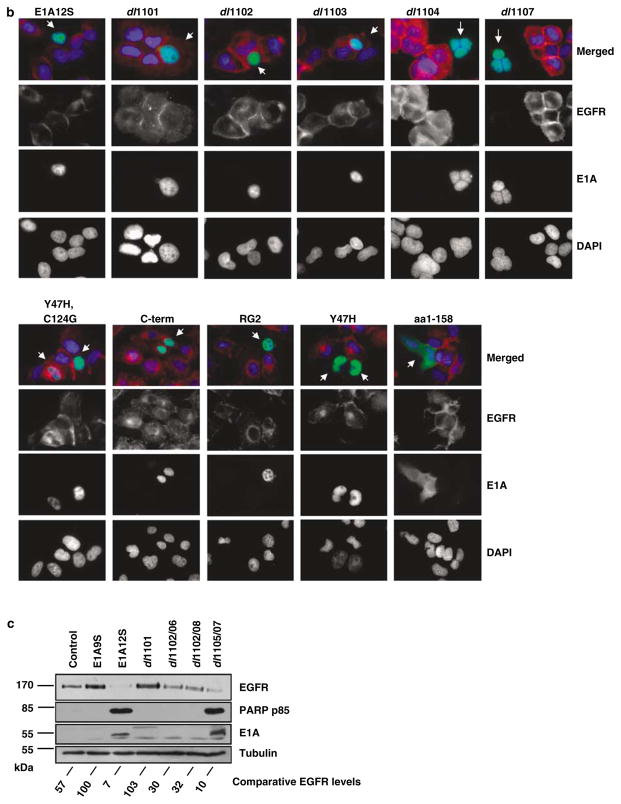
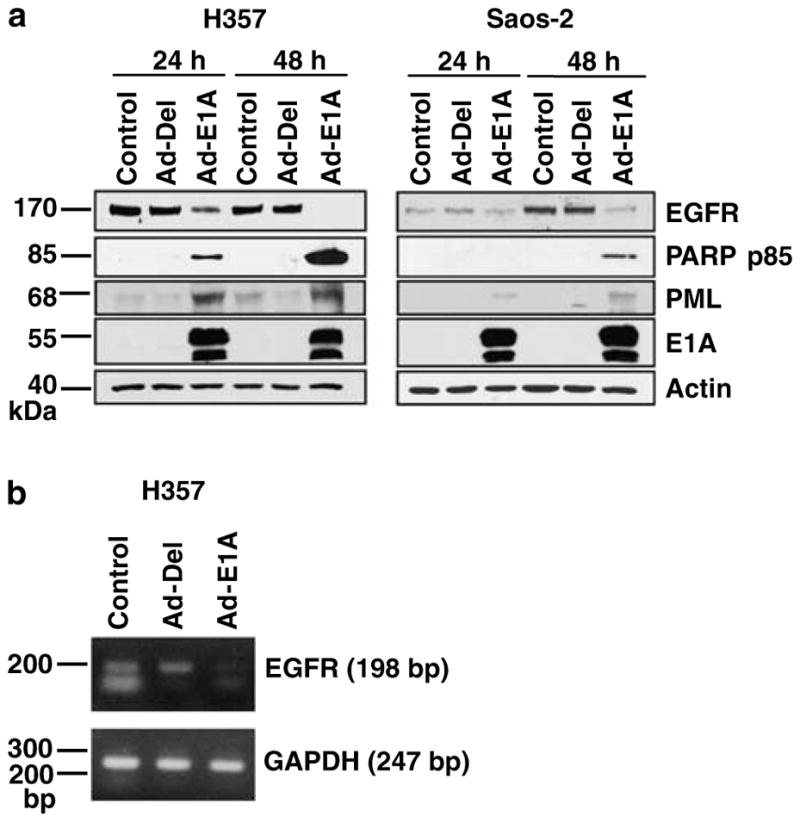
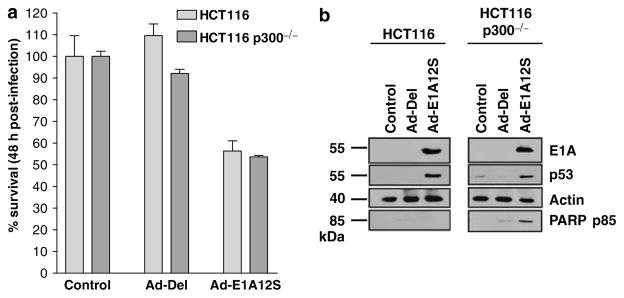
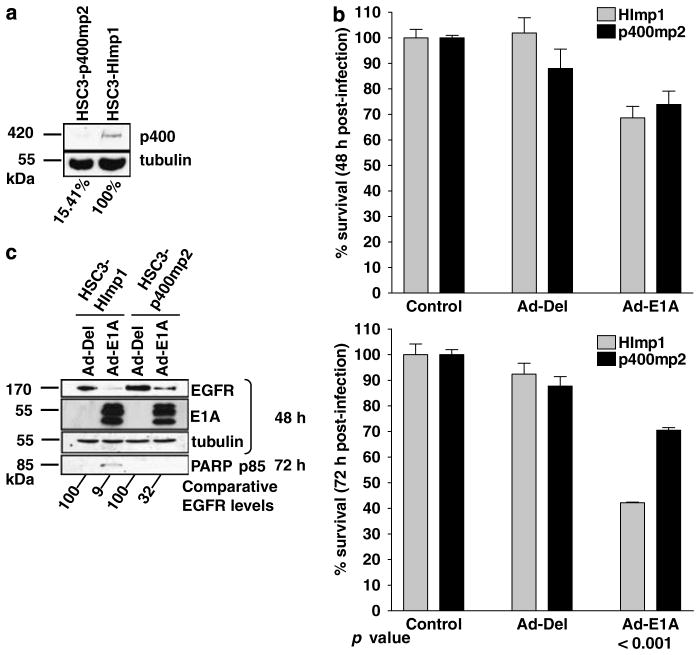
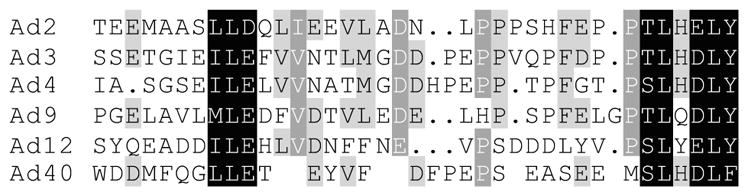
We have recently shown that E1A protein of human adenovirus downregulates epidermal growth factor receptor (EGFR) expression and induces apoptosis in head and neck (HNSCC) and lung cancer cells independently of their p53 status. E1A has five isoforms of which the major ones E1A12S and E1A13S regulate transcription of cellular genes by binding to transcriptional modulators such as pRB, CtBP, p300 and p400. In this study, we have identified E1A12S isoform to have the highest effect on EGFR suppression and induction of apoptosis in HNSCC cells. Similar to Ad5, E1A12S from human adenovirus types 2, 3, 9 and 12 suppressed EGFR, whereas E1A12S of adenovirus types 4 and 40 had no effect on EGFR expression. Using deletion mutants of E1A12S we have shown that interaction of E1A with p400, but not p300 or pRB, is required for EGFR suppression and apoptosis. Inhibition of p400 by short hairpin RNA confirmed that HNSCC cells with reduced p400 expression were less sensitive to E1A-induced suppression of EGFR and apoptosis. p300 function was shown to be dispensable, as cells expressing E1A mutants that are unable to bind p300, or p300 knockout cells, remained sensitive to E1A-induced apoptosis. In summary, this study identifies p400 as an important mediator of E1A-induced downregulation of EGFR and apoptosis.


Figures

Figure 1
Figure 1
(a) Different splice variants of the E1A gene are schematically depicted. Boxes represent coding sequences. The coding sequence represented by the light grey box in E1A9S is in a different frame from the other coding sequences. The number of amino acids of the encoded E1A isoforms and the positions of the conserved regions CR1, CR2, CR3 and CR4 in the different E1A splice variants are indicated (CR positions have previously been described in Avvakumov et al., 2002, 2004). (b) Downregulation of EGFR expression by adenovirus type 2 E1A12S. HN5 cells were transiently transfected with plasmids expressing adenovirus type 2 E1A9S, E1A10S, E1A11S, E1A12S and E1A13S fused to GFP. Cells were fixed 48 h post-transfection and stained for EGFR by indirect immunofluorescent staining using anti-EGFR F4 primary antibody and Texas-Red-labelled secondary anti-mouse antibody. Cells were mounted in DAPI-containing solution. EGFR stained red and E1A-GFP was observed as green. E1A expressing cells are indicated with white arrows. Abbreviations: CR, conserved region; DAPI, 4′,6-diamino-2-phenylindole; EGFR, epidermal growth factor receptor; GFP, green fluorescent protein.
Figure 2
Figure 2
Downregulation of EGFR expression by the 12S-encoded E1A proteins of human adenovirus types 2, 3, 9 and 12, but not 4 and 40. HN5 cells were transiently transfected with GFP plasmids expressing E1A12S of different human adenovirus types. Cells were fixed 48 h post-transfection and stained for EGFR by indirect immunofluorescent staining using anti-EGFR F4 primary antibody and Texas-Red-labelled secondary anti-mouse antibody. Cells were mounted in DAPI-containing solution. EGFR stained red and E1A-GFP was observed as green. E1A expressing cells are indicated with white arrows. Abbreviations: DAPI, 4′,6-diamino-2-phenylindole; EGFR, epidermal growth factor receptor; GFP, green fluorescent protein.
Figure 3
Figure 3
Downregulation of EGFR expression by adenovirus type 2 E1A is p400-dependent. (a) Map showing adenovirus type 2 E1A12S deletion mutants and the regions required for binding to p300, p400 and pRB. Binding of E1A and its mutants to the indicated proteins was graded as complete (+), reduced (+/−) or none (−) (Wang et al., 1993). (b) HN5 cells were transiently transfected with plasmids expressing GFP fused to E1A12S or deletion mutants that are unable to bind p300 (dl1101, dl1103 and dl1104, RG2), p400 (dl1101 and dl1102) or pRB (dl1107, Y47H and Y47H,C124G), as well as the C-terminal region of E1A, (C-term). Cells were fixed 48 h post-transfection and stained for EGFR by indirect immunofluorescent staining using anti-EGFR F4 primary antibody and Texas-Red-labelled secondary anti-mouse antibody. Cells were mounted in DAPI-containing solution. EGFR stained red and E1A-GFP was observed as green. E1A expressing cells are indicated with white arrows. (c) H357 cells were infected with adenovirus expressing E1A12S and deletion mutants that are unable to bind p300 (dl1101), p400 (dl1101, dl1102/06 and dl1102/08) or pRB (dl1105/07) as well as control expressing only the E1A9S product. Cells were lysed 48 h post-infection and equal amounts of total protein from each sample was separated by SDS–PAGE, transferred to nitrocellulose and hybridized using different antibodies as described in the Materials and methods section. The intensity of tubulin and EGFR bands from the western blot was measured using Version 2.0 of Aida 2D Densitometry software. The amount of EGFR protein was normalized with tubulin expression level to correct for loading differences. The percentage of EGFR expression of H357 cells infected with Ad-E1A12S and its mutants was calculated with respect to the EGFR expression of control Ad-E1A9S-infected H357 cells which was set at 100%. Abbreviations: EGFR, epidermal growth factor receptor; GFP, green fluorescent protein; SDS–PAGE, lauryl sulphate–polyacrylamide gel electrophoresis.
Figure 3
Figure 3
Downregulation of EGFR expression by adenovirus type 2 E1A is p400-dependent. (a) Map showing adenovirus type 2 E1A12S deletion mutants and the regions required for binding to p300, p400 and pRB. Binding of E1A and its mutants to the indicated proteins was graded as complete (+), reduced (+/−) or none (−) (Wang et al., 1993). (b) HN5 cells were transiently transfected with plasmids expressing GFP fused to E1A12S or deletion mutants that are unable to bind p300 (dl1101, dl1103 and dl1104, RG2), p400 (dl1101 and dl1102) or pRB (dl1107, Y47H and Y47H,C124G), as well as the C-terminal region of E1A, (C-term). Cells were fixed 48 h post-transfection and stained for EGFR by indirect immunofluorescent staining using anti-EGFR F4 primary antibody and Texas-Red-labelled secondary anti-mouse antibody. Cells were mounted in DAPI-containing solution. EGFR stained red and E1A-GFP was observed as green. E1A expressing cells are indicated with white arrows. (c) H357 cells were infected with adenovirus expressing E1A12S and deletion mutants that are unable to bind p300 (dl1101), p400 (dl1101, dl1102/06 and dl1102/08) or pRB (dl1105/07) as well as control expressing only the E1A9S product. Cells were lysed 48 h post-infection and equal amounts of total protein from each sample was separated by SDS–PAGE, transferred to nitrocellulose and hybridized using different antibodies as described in the Materials and methods section. The intensity of tubulin and EGFR bands from the western blot was measured using Version 2.0 of Aida 2D Densitometry software. The amount of EGFR protein was normalized with tubulin expression level to correct for loading differences. The percentage of EGFR expression of H357 cells infected with Ad-E1A12S and its mutants was calculated with respect to the EGFR expression of control Ad-E1A9S-infected H357 cells which was set at 100%. Abbreviations: EGFR, epidermal growth factor receptor; GFP, green fluorescent protein; SDS–PAGE, lauryl sulphate–polyacrylamide gel electrophoresis.
Figure 4
Figure 4
Adenovirus type 2 E1A downregulates EGFR protein and mRNA. (a) Western blot analysis showing expression of EGFR, PARP p85, E1A and actin using F4, G734A, M58 and anti-β-actin primary antibodies, respectively. H357 and Saos-2 cells were infected with Ad-E1A or control Ad-Del adenoviral vectors at a MOI of 10. Cells were lysed 24 and 48 h after infection, equal amounts of total protein from each sample was separated by SDS–PAGE, transferred to nitrocellulose and hybridized to different antibodies as described in the Materials and methods section. (b) E1A-mediated downregulation of EGFR mRNA. H357 cells were either untreated or infected with Ad-Del or Ad-E1A at a MOI of 10 and harvested 48 h after infection. PCR was performed on cDNA generated from whole mRNA. Specific EGFR was amplified using GAPDH as an internal control. The sizes of amplified fragments are indicated. Abbreviations: cDNA, complementary DNA; EGFR, epidermal growth factor receptor; GAPDH, glyceraldehyde 3-phosphate dehydrogenase; MOI, multiplicity of infection; PARP, poly (ADP ribose) polymerase; PCR, polymerase chain reaction; SDS–PAGE, lauryl sulphate–polyacrylamide gel electrophoresis.
Figure 5
Figure 5
(a) MTT analysis of HCT116 and HCT116 p300−/− cells 48 h after infection with Ad-E1A12S or control Ad-Del adenoviral vectors at a MOI of 10. Error bars indicate s.d. (b) Western blot analysis of HCT116 and HCT116 p300−/− cells infected with indicated recombinant adenoviruses. Cells were lysed 24 h after infection, equal amounts of total protein from each sample was separated by SDS–PAGE, transferred to nitrocellulose and hybridized to different antibodies as described in the Materials and methods section. Abbreviations: MOI, multiplicity of infection; MTT, 3-(4,5-dimethylthiazolyl-2)-2,5-diphenyltetrazolium bromide; SDS–PAGE, lauryl sulphate–polyacrylamide gel electrophoresis.
Figure 6
Figure 6
(a) Western blot analysis of HSC3 HI and p400 mixed populations. p400 was detected using anti-p400 RW144 monoclonal primary antibody and tubulin was detected using anti-tubulin monoclonal antibody (Sigma). The intensity of tubulin and p400 bands from the western blot was measured using Version 2.0 of Aida 2D Densitometry software. The amount of p400 protein was normalized with tubulin expression level to correct for loading differences. The percentage of p400 expression of HSC3-p400mp2 was calculated with respect to HSC3-HImp1, which was set at 100%. (b) MTT analysis of HSC3 HI and p400 mixed populations 48 and 72 h after infection with Ad-Del and Ad-E1A with a MOI of 10. Error bars indicate s.d. Statistical analysis was performed using Tukey’s Multiple Comparison Test, P-values are shown. (c) Western blot analysis of HSC3-HImp1 and HSC3-p400mp2 48 and 72 h after infection with indicated recombinant adenoviruses. Cells were lysed at 48 and 72 h post-infection, equal amounts of total protein from each sample was separated by SDS–PAGE, transferred to nitrocellulose and hybridized to different antibodies as described in the Materials and methods section. The percentage of EGFR expression of cells infected with Ad-E1A was calculated with respect to the EGFR expression of control Ad-Del-infected cells, which was set at 100%. Abbreviations: EGFR, epidermal growth factor receptor; MTT, 3-(4,5-dimethylthiazolyl-2)-2,5-diphenyltetrazolium bromide; SDS–PAGE, lauryl sulphate–polyacrylamide gel electrophoresis.
Figure 7
Figure 7
Alignment of the homologous regions of the six different E1As used in this study (adapted from Avvakumov et al., 2004). The sequence spans amino acids 12–47 of Ad2 E1A, which corresponds to the region required for interaction to p400 (Barbeau et al., 1994; Samuelson et al., 2005). Shading is based on similarity as defined by the Blosum 45 score table.

Similar articles

Cited by

References

    1. Avvakumov N, Kajon AE, Hoeben RC, Mymryk JS. Comprehensive sequence analysis of the E1A proteins of human and simian adenoviruses. Virology. 2004;329:477–492. - PubMed
    1. Avvakumov N, Wheeler R, D’Halluin JC, Mymryk JS. Comparative sequence analysis of the largest E1A proteins of human and simian adenoviruses. J Virol. 2002;76:7968–7975. - PMC - PubMed
    1. Barbeau D, Charbonneau R, Whalen SG, Bayley ST, Branton PE. Functional interactions within adenovirus E1A protein complexes. Oncogene. 1994;9:359–373. - PubMed
    1. Bergman LM, Blaydes JP. C-terminal binding proteins: emerging roles in cell survival and tumorigenesis. Apoptosis. 2006;11:879–888. - PubMed
    1. Chan HM, Narita M, Lowe SW, Livingston DM. The p400 E1A-associated protein is a novel component of the p53 –> p21 senescence pathway. Genes Dev. 2005;19:196–201. - PMC - PubMed

Publication types

MeSH terms