. 2007 May 9;2(5):e437.
doi: 10.1371/journal.pone.0000437.

Basal body positioning is controlled by flagellum formation in Trypanosoma brucei

Affiliations

Basal body positioning is controlled by flagellum formation in Trypanosoma brucei

Sabrina Absalon et al. PLoS One. .

Abstract

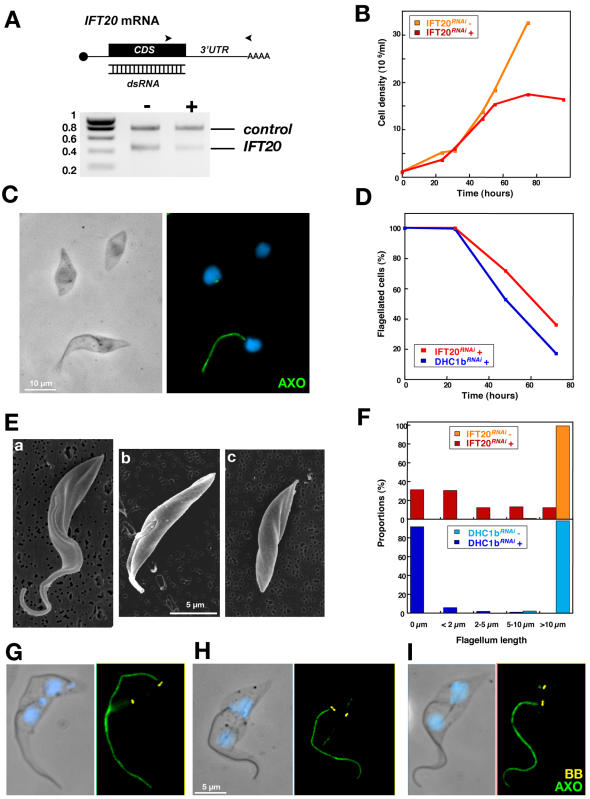
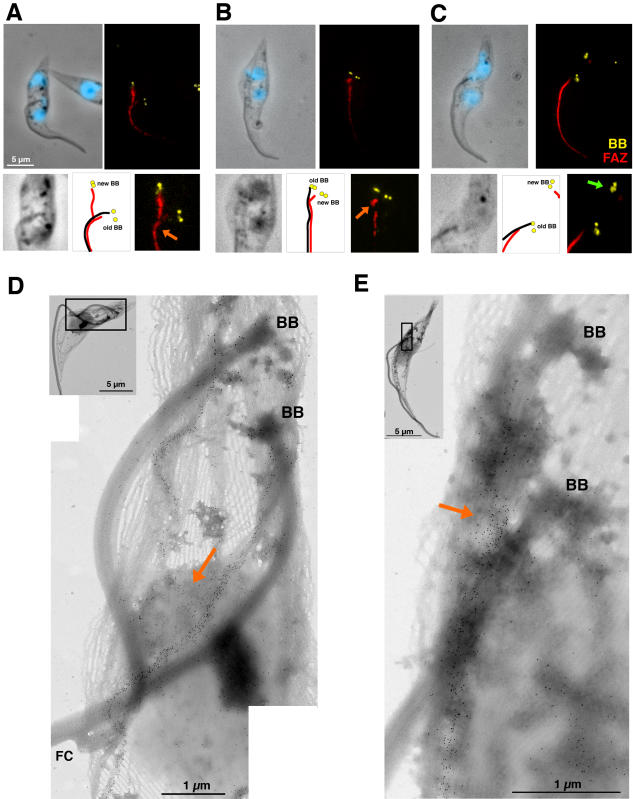
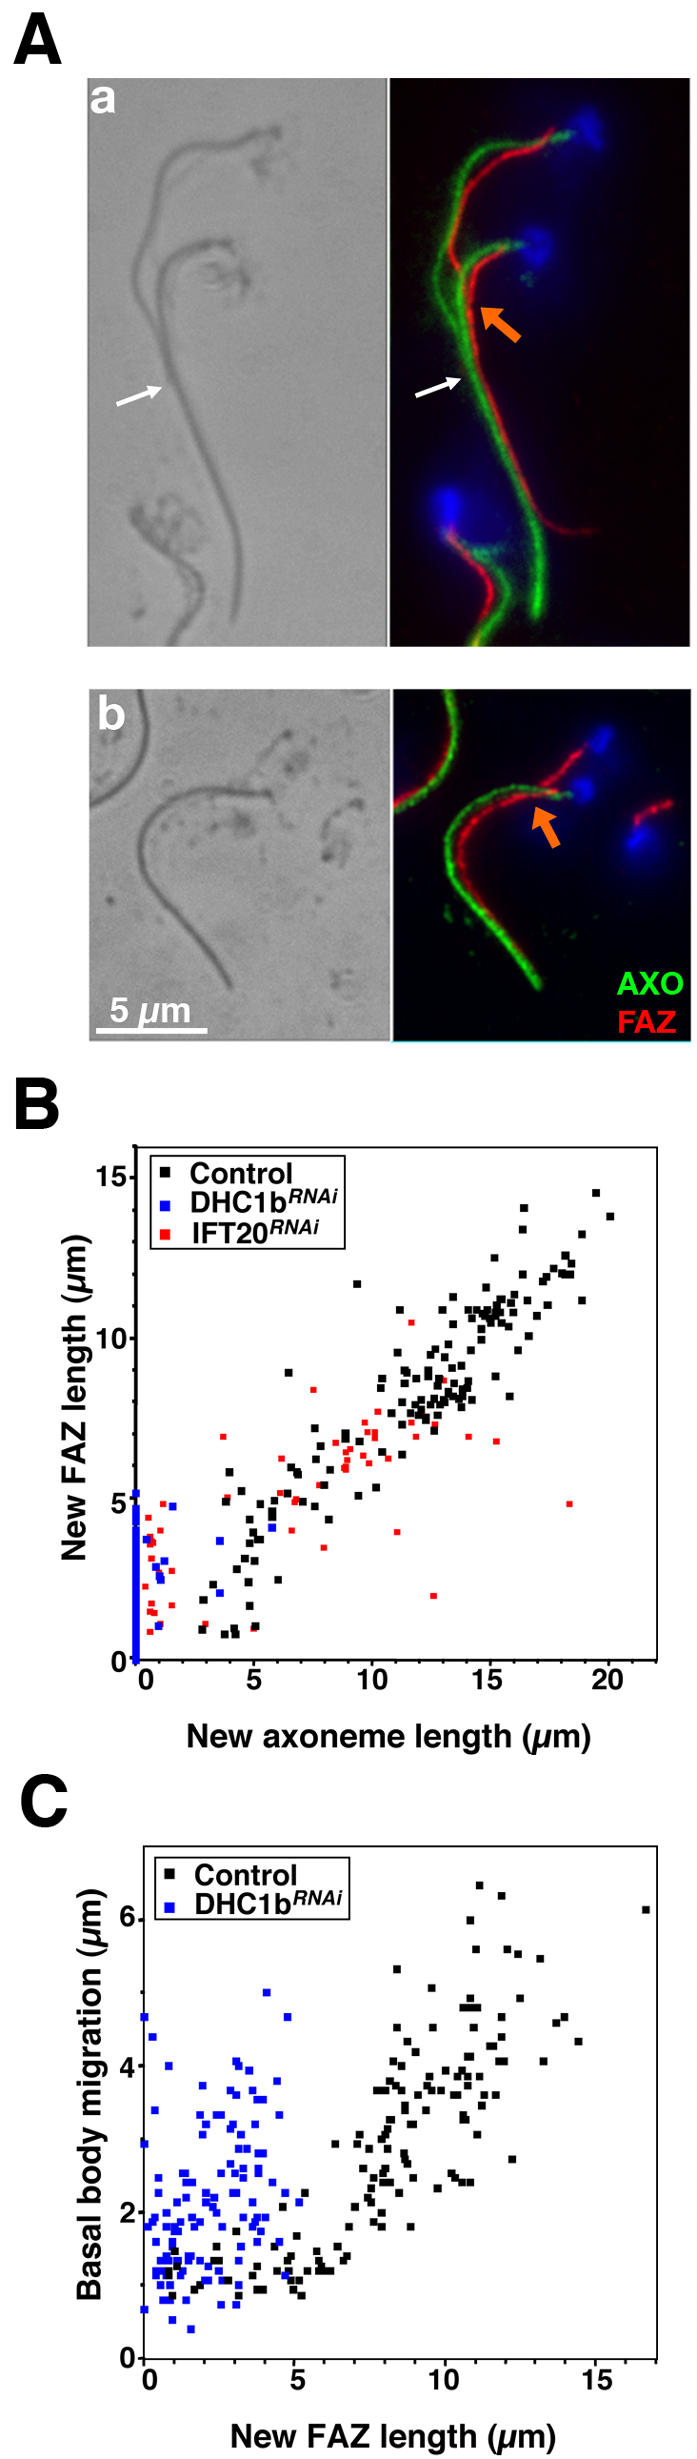
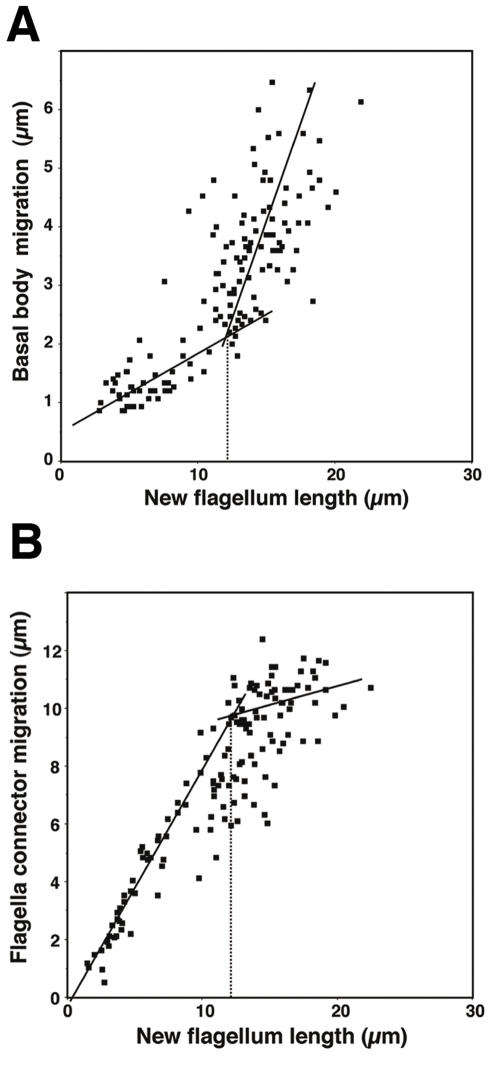
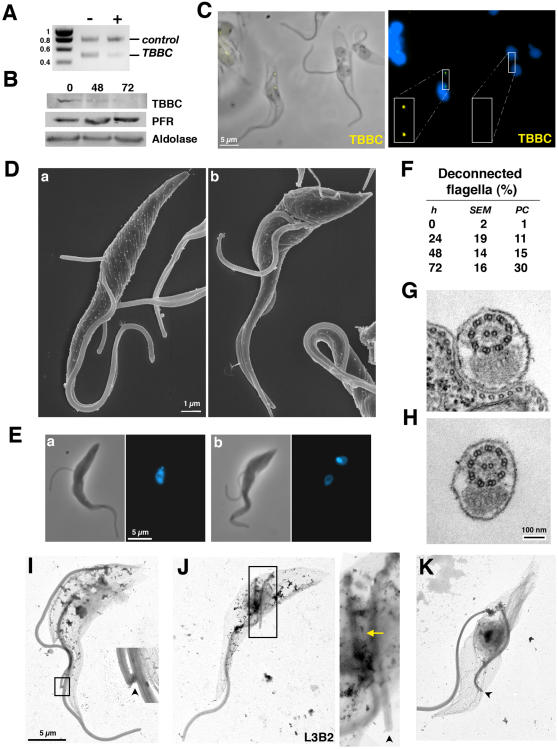
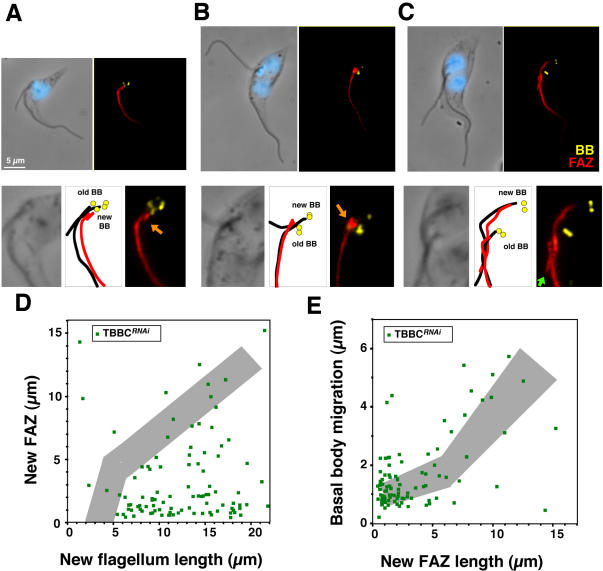
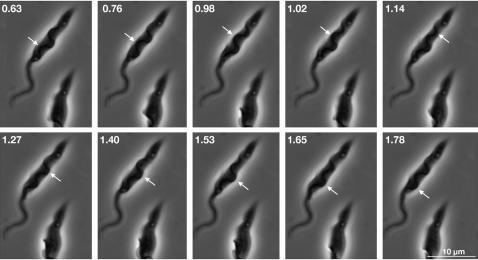
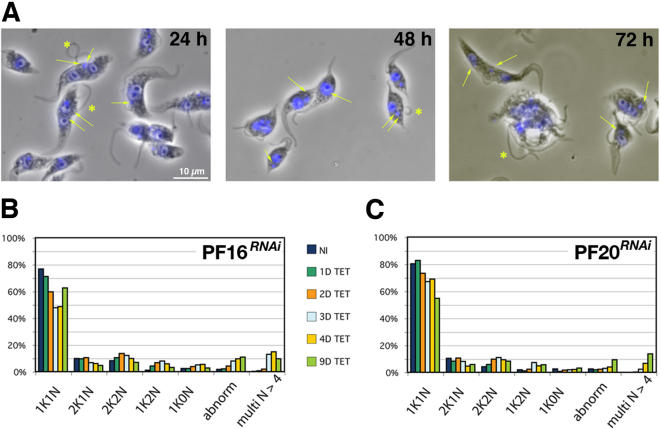
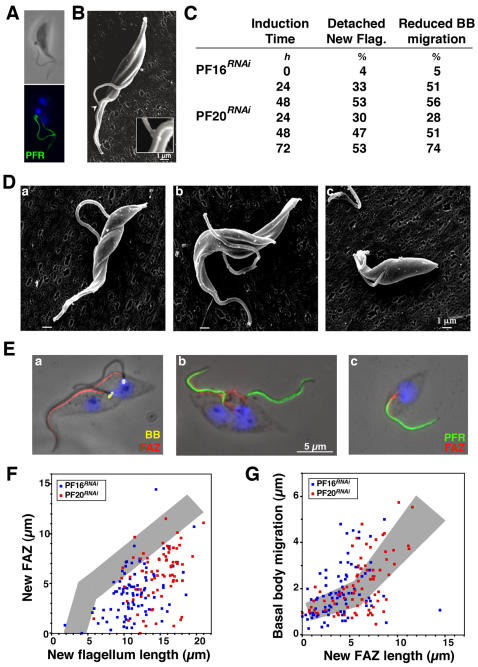
To perform their multiple functions, cilia and flagella are precisely positioned at the cell surface by mechanisms that remain poorly understood. The protist Trypanosoma brucei possesses a single flagellum that adheres to the cell body where a specific cytoskeletal structure is localised, the flagellum attachment zone (FAZ). Trypanosomes build a new flagellum whose distal tip is connected to the side of the old flagellum by a discrete structure, the flagella connector. During this process, the basal body of the new flagellum migrates towards the posterior end of the cell. We show that separate inhibition of flagellum assembly, base-to-tip motility or flagella connection leads to reduced basal body migration, demonstrating that the flagellum contributes to its own positioning. We propose a model where pressure applied by movements of the growing new flagellum on the flagella connector leads to a reacting force that in turn contributes to migration of the basal body at the proximal end of the flagellum.


Conflict of interest statement

Competing Interests: The authors have declared that no competing interests exist.

Figures

Figure 1
Figure 1. IFT20 is required for flagellum formation and for correct basal body migration.
A. RT-PCR using aldolase and IFT20 primers (positions indicated by arrowheads) on total RNA from IFT20RNAi cells grown with (+) or without (−) tetracycline for 72 hours, showing IFT20 RNA silencing. B. Growth curve of induced (+) and non-induced (−) IFT20RNAi cells. C. Field of IFT20RNAi cells induced for 72 h and stained with MAb25 (axoneme [AXO] marker, green) and DAPI (blue) showing cells without flagella or with a flagellum of shorter length. D. Proportion of cells with a flagellum during induction of RNAi silencing in IFT20RNAi or in DHC1bRNAi (extent of DHC1b RNAi knock-down has been previously demonstrated [17]) E. Scanning electron micrographs of IFT20RNAi cells induced for 72 h illustrating three kinds of cells: with a normal flagellum (a), with a short flagellum (b) and without flagellum at all (c). F. Length of the new flagellum (when present) in bi-nucleated cells of the indicated cell lines. Cells were grouped in categories according to the indicated flagellar length. G–I. Bi-nucleated cells from non-induced (G) and 72h-induced IFT20RNAi cells (H–I) stained with MAb22 (basal body marker [BB], yellow), MAb25 (axoneme [AXO] marker, green) and DAPI (blue).
Figure 2
Figure 2. FAZ restricts basal body migration.
A–C. Top panels, detergent-extracted cytoskeletons of DHC1bRNAi cells induced for 41 h stained with MAb22 (basal body marker [BB], yellow), L3B2 (FAZ marker, red) and DAPI (blue). Bottom panels: 2-fold magnification of the basal body area of the above images. Diagrams show the position of the old (with a flagellum) and new (without a flagellum) basal bodies as well as positioning of the flagellum (black lines) and the FAZ filament (red lines). DAPI has been omitted from phase contrast images to facilitate visualisation of the flagellar structures. A–B. Presence of a short new FAZ contacting the old one (orange arrows) appears to refrain new basal body migration. C. Extensive basal body migration when the new FAZ is not in contact with the old one (green arrow). D–E. Detergent-extracted cytoskeletons of non-induced (D) or 48h-induced (E) DHC1bRNAi cells stained with L3B2 (immunogold) showing interaction between new and old FAZ (orange arrows). Basal bodies (BB) are found at the proximal end of the flagella (when present) and are easily recognised by their thicker wall (due to the presence of triplet microtubules [12]).
Figure 3
Figure 3. FAZ restricts basal body migration.
A. Non-induced (a) or 48h-induced (b) DHC1bRNAi cells treated with calcium, leading to de-polymerisation of the microtubule corset but not of the FAZ filament. Samples were stained with L6B3 (FAZ marker, red), KMX (anti-tubulin, axoneme [AXO] marker, green) and DAPI (blue). Contacts between old and new FAZ filaments are visible (orange arrow), even in the absence of a new flagellum. The position of the FC on the non-induced cell (top panels) is indicated by a white arrow. B. Length of the new FAZ relative to that of the new flagellum in the indicated cell lines (n>100). FAZ length was measured using the DOT-1 or the L3B2 monoclonal antibody in IFT20RNAi and DHC1bRNAi cells respectively. Please note that spots corresponding to IFT20RNAi cells without a flagellum are hidden by the corresponding spots from DHC1bRNAi cells. C. Basal body migration relative to FAZ length in the same cells as in H (excepted for IFT20RNAi cells where basal body migration was measured in a separate experiment).
Figure 4
Figure 4. FC migration along the old flagellum is bimodal.
A–B. New flagellum length, inter basal body distance and position of the FC on the old flagellum were measured in bi-flagellated wild-type cells at any stage of flagellum assembly.
Figure 5
Figure 5. TBBC is necessary for flagella connection.
A. RT-PCR using TBBC and aldolase primers demonstrates specific TBBC RNA silencing as described at Fig. 1A. B. Western blot analysis of TBBCRNAi cells grown with tetracycline for the indicated periods of time. The same membrane was probed with antibodies against the indicated proteins. C. Immunofluorescence of TBBCRNAi cells induced for 72 h with the anti-TBBC antibody (yellow) stained with DAPI (blue) showing two bi-flagellated cells, one with normal TBBC staining (left) and one without labelling (right, see insets). Lack of flagella connection is exclusively observed in the latter category. D. Scanning electron micrograph of bi-flagellated cells from TBBCRNAi cells induced for 48 h. The tip of the new flagellum is free and the flagellum is detached at early (a) and late (b) stages of elongation. E. Glutaraldehyde fixation of similar cells coming from the same population but analysed after DAPI staining. F. The proportion of cells with a deconnected and detached new flagellum (n = 100) during the course of induction (analysed by scanning electron microscopy [SEM] or phase contrast optics [PC]). G–H. Cross-sections of attached (G) or detached (H) flagella from TBBCRNAi cells induced for 72 h revealing similar ultra-structural organisation. I–K. Detergent-extracted cytoskeletons of 72h-induced TBBCRNAi cells. When the new flagellum is still connected to the old (I), a clear FC structure is visible (arrowhead). By contrast, no FC is recognised when the new flagellum is not connected, no matter flagellum length (J–K). J. L3B2 staining revealing interactions between old and new FAZ (yellow arrow).
Figure 6
Figure 6. FAZ formation and basal body migration are severely perturbed in the absence of flagella connection.
A–C. Top panels: Double labelling of TBBCRNAi detergent-extracted cells induced for 72 h stained with MAb22 (basal body marker [BB], yellow), L3B2 (FAZ marker, red) and DAPI (blue). Bottom panels: 2-fold magnification of the basal body area of the above images. Diagrams show the position of the old and new basal bodies, as well as positioning of the flagellum (black lines) and the FAZ filament (red lines). A–B. Cells with a short FAZ in close proximity to the old one (orange arrows) have a very limited basal body migration. C. A rare cell with a longer FAZ and normal basal body migration. Note the absence of contact between the tip of the new FAZ and the old FAZ filament (green arrow). D. FAZ length (measured by using the L3B2 signal) is reduced in the absence of flagella connection. Grey shows the range for controls cells (data from Fig. 2). E. Basal body migration compared to FAZ elongation in the same cells.
Figure 7
Figure 7. The new flagellum displays both tip-to-base and base-to-tip movements.
Still images of Movie S2 (Supp. Mat.). Numbers indicate time in seconds and hundredths of seconds. Arrows indicate propagation of one wave bend (from tip to base on the first 4 images, from base to tip for the other ones).
Figure 8
Figure 8. Inhibition of tip-to-base motility leads to multiple cell cycle defects.
A. Phase contrast images of methanol-fixed PF16RNAi cells induced for 24, 48 and 72 h (left to right) stained with DAPI (blue). Arrows point at kinetoplast aberrantly positioned and stars indicate detached flagella. B–C. Distribution of cells according to kinetoplast (K) and nucleus (N) number in PF16RNAi cells (B) and PF20RNAi cells (C) grown in the presence of tetracycline for the indicated number of days.
Figure 9
Figure 9. Inhibition of tip-to-base motility results in defects in basal body migration.
A. Paraformaldehyde-fixed PF16RNAi cell induced for 48 h stained with DAPI (blue) and ROD-1 (PFR, green). Only one kinetoplast is visible with two nuclei, two flagella and un-segregated basal bodies. B. Scanning electron micrograph revealing the presence of the FC at the distal end of the detached but not de-connected new flagellum. C. Flagellum attachment and basal body migration in bi-flagellated cells in the indicated cell lines during the course of RNAi silencing (n>50). D–E. PF16RNAi cells induced for 48 h with a detached new flagellum (a), with a detached and de-connected new flagellum (b) and a uniflagellated cell whose flagellum is not positioned properly (c). D. Scanning electron micrographs. E. Detergent-extracted cytoskeletons stained with MAb22 (basal body [BB] marker, yellow), L3B2 (FAZ marker, red, and DAPI (blue, left panel) or with ROD-1 (PFR marker, that is found in the flagellum as soon as it emerges from the flagellar pocket, green), L3B2 (FAZ marker, red) and DAPI (blue, right panels). F. FAZ length measured using the L3B2 antibody is reduced in PF16RNAi or PF20RNAi cells with a detached new flagellum at all stages of flagellum elongation (n>100). Grey shows control cells (see Fig. 2). G. Basal body migration compared to FAZ elongation in the same cells.

References

    1. Kohl L, Bastin P. The flagellum of trypanosomes. Int Rev Cytol. 2005;244:227–285. - PubMed
    1. Singla V, Reiter JF. The primary cilium as the cell's antenna: signaling at a sensory organelle. Science. 2006;313:629–633. - PubMed
    1. Beisson J, Wright M. Basal body/centriole assembly and continuity. Curr Opin Cell Biol. 2003;15:96–104. - PubMed
    1. Kozminski KG, Johnson KA, Forscher P, Rosenbaum JL. A motility in the eukaryotic flagellum unrelated to flagellar beating. Proc Natl Acad Sci U S A. 1993;90:5519–5523. - PMC - PubMed
    1. Rosenbaum JL, Witman GB. Intraflagellar transport. Nat Rev Mol Cell Biol. 2002;3:813–825. - PubMed

Publication types

LinkOut - more resources