. 2007 Jun 5;46(22):6525-35.
doi: 10.1021/bi700335n. Epub 2007 May 9.

Probing Na(+)-induced changes in the HIV-1 TAR conformational dynamics using NMR residual dipolar couplings: new insights into the role of counterions and electrostatic interactions in adaptive recognition

Affiliations

Probing Na(+)-induced changes in the HIV-1 TAR conformational dynamics using NMR residual dipolar couplings: new insights into the role of counterions and electrostatic interactions in adaptive recognition

Anette Casiano-Negroni et al. Biochemistry. .

Abstract

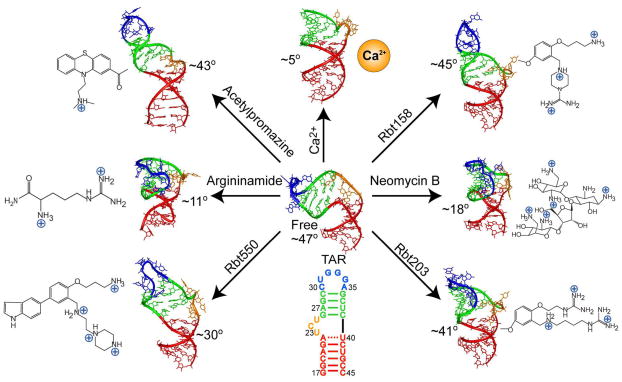
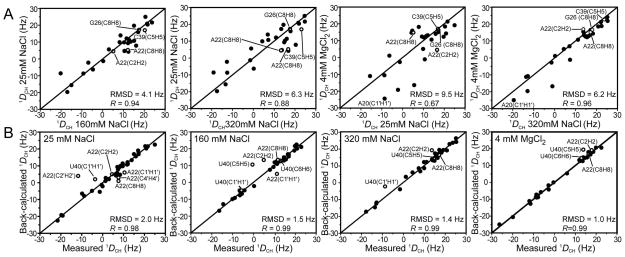
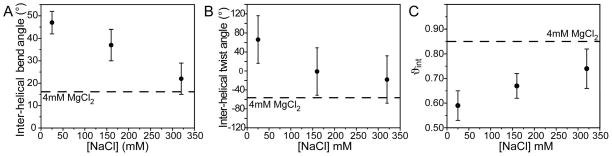
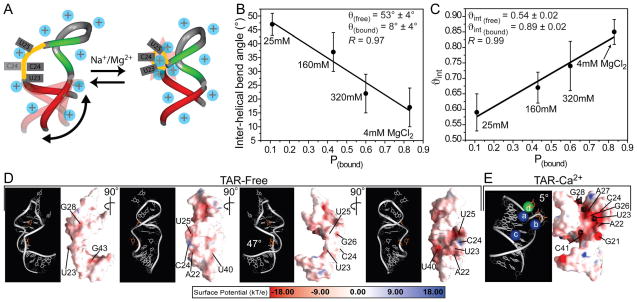
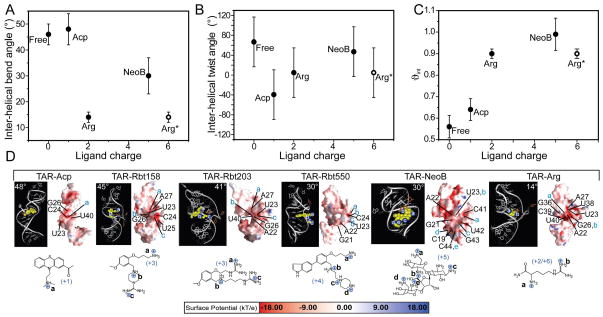
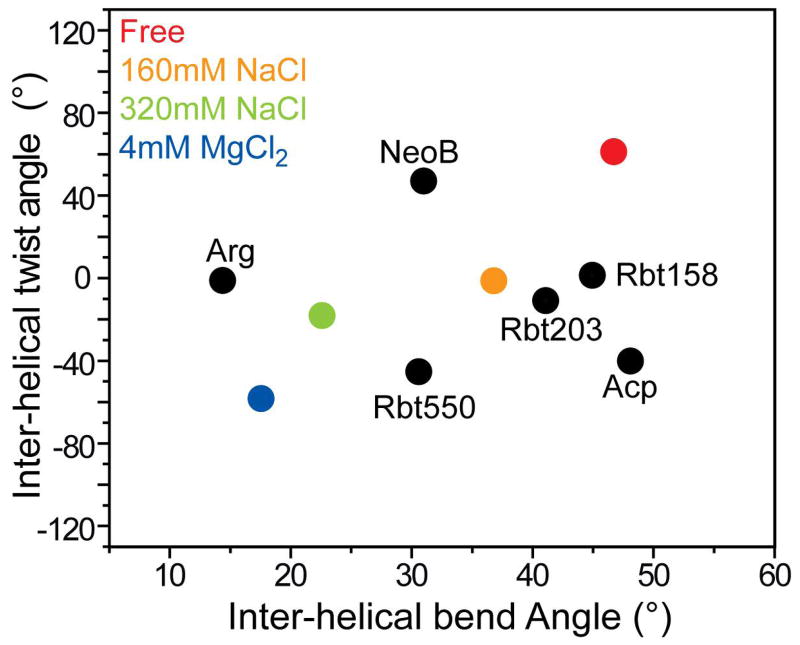
Many regulatory RNAs undergo large changes in structure upon recognition of proteins and ligands, but the mechanism by which this occurs remains poorly understood. Using NMR residual dipolar coupling (RDCs), we characterized Na+-induced changes in the structure and dynamics of the bulge-containing HIV-1 transactivation response element (TAR) RNA that mirrors changes induced by small molecules bearing a different number of cationic groups. Increasing the Na+ concentration from 25 to 320 mM led to a continuous reduction in the average inter-helical bend angle (from 46 degrees to 22 degrees ), inter-helical twist angle (from 66 degrees to -18 degrees ), and inter-helix flexibility (as measured by an increase in the internal generalized degree of order from 0.56 to 0.74). Similar conformational changes were observed with Mg2+, indicating that nonspecific electrostatic interactions drive the conformational transition, although results also suggest that Na+ and Mg2+ may associate with TAR in distinct modes. The transition can be rationalized on the basis of a population-weighted average of two ensembles comprising an electrostatically relaxed bent and flexible TAR conformation that is weakly associated with counterions and a globally rigid coaxial conformation that has stronger electrostatic potential and association with counterions. The TAR inter-helical orientations that are stabilized by small molecules fall around the metal-induced conformational pathway, indicating that counterions may help predispose the TAR conformation for target recognition. Our results underscore the intricate sensitivity of RNA conformational dynamics to environmental conditions and demonstrate the ability to detect subtle conformational changes using NMR RDCs.


Figures

Figure 1
Figure 1
Conformation of HIV-1 TAR in free form and bound to distinct molecular targets (, , –26). The inter-helical bend angle is indicated next to each conformation.
Figure 2
Figure 2
Chemical shift mapping of Na+ and Mg2+ association with TAR RNA. On the left, the secondary structure of the TAR construct used in this study. The wild-type loop is replaced with a UUCG loop. (A) 2D HSQC spectra of TAR recorded in the presence of Na+ (25 mM, 160 mM and 320 mM) and Mg2+ (25 mM Na+/4 mM Mg2+). Residues undergoing the largest chemical shift perturbations (top 20% for a given type of resonance) upon Na+ and Mg2+ binding are highlighted in blue and purple square boxes respectively on the TAR secondary structure. (B) Representative Na+ and Mg2+ titration curves with Kd values ( in M for Na+ and mM for Mg2+) shown at the end of each curve.
Figure 3
Figure 3
(A) Comparison of RDCs measured at 25 mM, 160 mM, and 320 mM Na+ and Mg2+ (25 mM Na+/4 mM Mg2+). The RDCs are normalized (relative to 25 mM Na+) to account for differences in the degree of order. This was done by scaling the RDCs measured under salt condition “X” by the ratio of stem II degree of order measured at X and 25 mM (i.e. through multiplication by ϑNa-25mMX). Stem II was chosen since it dominates the total degree of alignment in all cases (Table 1). (B) Order tensor fits against an idealized A-form geometry carried out independently for stems I and II using RDCs measured at 25 mM, 160 mM, and 320 mM Na+ and 25 mM Na+/4 mM Mg2+. Shown in each case is the root-mean square deviation (rmsd) between measured and back-predicted RDCs as well as the correlation coefficient (R).
Figure 4
Figure 4
Probing the metal induced TAR structure-dynamical transition using an order tensor analysis of RDCs. Shown are the (A) inter-helical bend angle (θ), (B) inter-helical twist angle (ξ) (positive/negative values correspond to over/under twisting respectively), and (C) inter-helical mobility (ϑint) as a function of Na+ concentration. Values in the presence of 25 mM Na+/4 mM Mg2+ are shown using a horizontal line.
Figure 5
Figure 5
(A) Two-state model for the metal-induced TAR structural transition. (B–C) Fitting of the observed (B) inter-helical bend angle (θ(obs)) and (C) amplitude of inter-helical motions (ϑint(obs) as a function of the fractional bound populations (pbound) using Equation 2. The “free” and “bound” θ and ϑint values obtained from the fit are shown together with the correlation coefficient (R). (D–E) Electrostatic surfaces for TAR (D) in “free” form (PDB ID#1ANR) (19) under moderate ionic strength conditions (50mM NaCl and 5mM phosphate buffer) with different views showing the weaker electrostatic potential and (E) bound to Ca2+ cations (PDB ID#397D) (20) with residues undergoing the largest metal-induced chemical shift perturbations highlighted.
Figure 6
Figure 6
TAR conformational dynamics when bound to the small molecules argininamide (ARG), acetylpromazine (ACP), neomycin B (NeoB), Rbt 158, Rbt 203, and Rbt 550. Shown are the (A) inter-helical bend angle (θ), (B) inter-helical twist angle (ξ), and (C) amplitude of inter-helical motions (ϑint) as a function of total positive charge delivered by the small molecules. The inter-helical bend angles for ARG, ACP, and NeoB were obtained from order tensor analysis of RDCs, as reported previously (35, 72). For remaining structures, the angles were obtained from model 1 of the NOE-based NMR structure (Rbt 158, Rbt 203, and Rbt 550) (25, 26) or the X-ray structure (Ca2+) (20). For ARG, which has a charge of +2, a total charge of +6 is also shown based on surface plasmon resonance measurements that indicate that up to three ARG molecules bind TAR (26). For Ca2+, a charge of +8 is assumed based on observation of 4 × Ca2+ ions in the X-ray structure (20). (D) Electrostatic surfaces for the bound TAR structures following removal of ligands. Highlighted in blue letters are the positions of cationic groups on small molecules relative to the TAR electrostatic surface. The TAR orientation in each case was chosen to illustrate proximity of cationic groups near the strong negative TAR charge potential.
Figure 7
Figure 7
Comparison of metal and small molecule induced changes in the TAR inter-helical conformation.

Similar articles

Cited by

References

    1. Leulliot N, Varani G. Current topics in RNA-protein recognition: Control of specificity and biological function through induced fit and conformational capture. Biochemistry. 2001;40:7947–7956. - PubMed
    1. Micura R, Hobartner C. On secondary structure rearrangements and equilibria of small RNAs. Chembiochem. 2003;4:984–990. - PubMed
    1. Al-Hashimi HM. Dynamics-Based Amplification of RNA Function and Its Characterization by Using NMR Spectroscopy. Chembiochem. 2005;6:1506–1519. - PubMed
    1. Storz G, Altuvia S, Wassarman KM. An abundance of RNA regulators. Annu Rev Biochem. 2005;74:199–217. - PubMed
    1. Williamson JR. Induced fit in RNA-protein recognition. Nat Struct Biol. 2000;7:834–837. - PubMed

Publication types

MeSH terms