Review
. 2007 Jun;210(6):671-83.
doi: 10.1111/j.1469-7580.2007.00724.x. Epub 2007 May 7.

Three-dimensional confocal morphometry - a new approach for studying dynamic changes in cell morphology in brain slices

Affiliations
Review

Three-dimensional confocal morphometry - a new approach for studying dynamic changes in cell morphology in brain slices

Alexandr Chvátal et al. J Anat. 2007 Jun.

Abstract

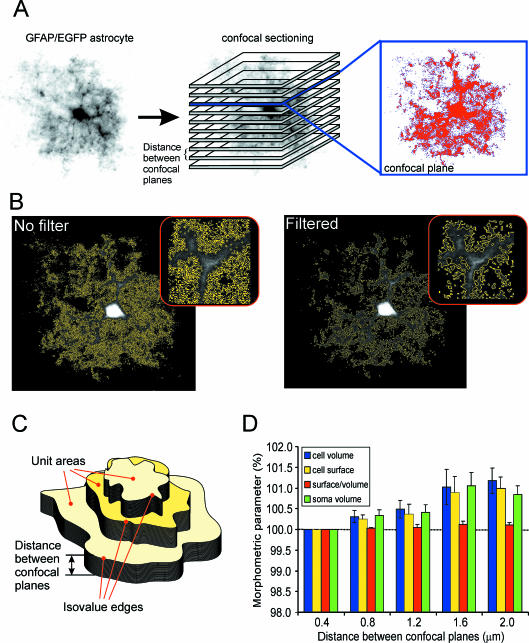
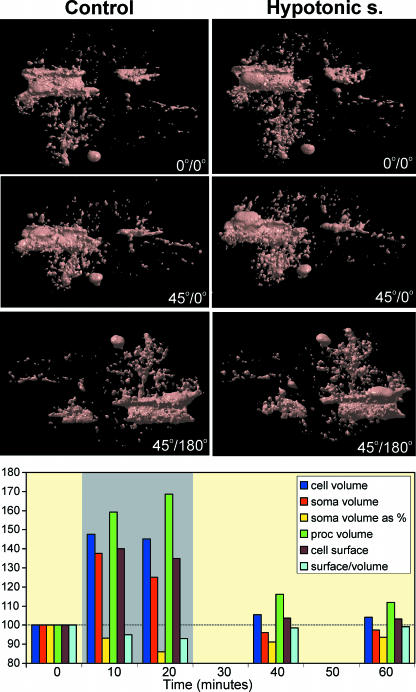
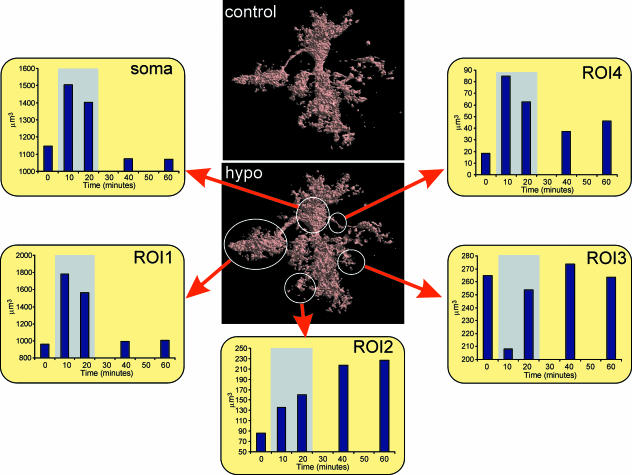
Pathological states in the central nervous system lead to dramatic changes in the activity of neuroactive substances in the extracellular space, to changes in ionic homeostasis and often to cell swelling. To quantify changes in cell morphology over a certain period of time, we employed a new technique, three-dimensional confocal morphometry. In our experiments, performed on enhanced green fluorescent protein/glial fibrillary acidic protein astrocytes in brain slices in situ and thus preserving the extracellular microenvironment, confocal morphometry revealed that the application of hypotonic solution evoked two types of volume change. In one population of astrocytes, hypotonic stress evoked small cell volume changes followed by a regulatory volume decrease, while in the second population volume changes were significantly larger without subsequent volume regulation. Three-dimensional cell reconstruction revealed that even though the total astrocyte volume increased during hypotonic stress, the morphological changes in various cell compartments and processes were more complex than have been previously shown, including swelling, shrinking and structural rearrangement. Our data show that astrocytes in brain slices in situ during hypotonic stress display complex behaviour. One population of astrocytes is highly capable of cell volume regulation, while the second population is characterized by prominent cell swelling, accompanied by plastic changes in morphology. It is possible to speculate that these two astrocyte populations play different roles during physiological and pathological states.


Figures

Fig. 1
Fig. 1
Confocal morphometry of GFAP/EGFP astrocytes in brain slices. (A) Image of an astrocyte scanned using confocal microscopy, and obtained by volume rendering, i.e. recordings from all layers were superimposed. Parallel confocal planes superimposed on the astrocyte image indicate how a stack of images from a single cell was obtained. An example of a single image from one confocal plane showing a 2D cut through the astrocyte is shown in the inset. The image has been digitally filtered, and an area (marked by the red colour) of the image representing cellular structures is displayed. (B) Effect of the application of the digital filters shown in A. The border between the background (black) and the area of the image representing cellular structures is indicated by the yellow colour. Length values obtained from pixels indicating this border were used for calculating the cell surface area. (C) Scheme showing unit areas surrounded by isovalue edges and the distance between sections used for morphometric calculations. (D) Graph of the differences in morphometric parameters measured in a stack of images with different distances (0.4, 0.8, 1.2, 1.6 and 2.0 µm) between confocal planes. Morphometric values obtained using the smallest interlayer distance (0.4 µm) are plotted as 100%. Data from five cells that were scanned with an interlayer distance of 0.4 µm are shown. Stacks with larger distances were created from the original stacks by selecting every second image (0.8 µm), every third image (1.2 µm), every fourth image (1.6 µm) or every fifth image (2.0 µm).
Fig. 2
Fig. 2
Surface rendering of GFAP/EGFP astrocytes in situ. An example of surface rendering of three GFAP/EGFP astrocytes in brain slices. For 3D reconstruction, the same images filtered using convolution filters were used as for morphometric measurements. The rotation of the cells to a specific angle is indicated in each image.
Fig. 3
Fig. 3
Effect of hypotonic solution on the morphology and morphometric parameters of GFAP/EGFP astrocytes in situ. An example of morphological changes evoked by a 10-min application of hypotonic solution (200 mmol kg−1) on a surface-rendered GFAP/EGFP astrocyte. Surface rendering of the astrocyte before the application of hypotonic solution (left) shows a complex cell morphology. Hypotonic solution (right) evoked an increase in total cell volume (swelling). Similarly, the volume of some cell compartments increased, while other cell compartments did not change and yet others decreased in volume or were rearranged. The graph shows the effect of a 20-min application of hypotonic solution (200 mmol kg−1) on total cell volume, process volume, soma volume, soma volume expressed as a percentage of the total cell volume, cell surface area and the surface to volume ratio expressed as 2S/3Vof the cell shown above. The time of application of the hypotonic solution is indicated by the grey rectangle. Graph was constructed using real-time relationships.
Fig. 4
Fig. 4
Effect of hypotonic solution on the volume of GFAP/EGFP astrocyte compartments. The volume of the cell soma and various cell compartments during and after the application of hypotonic solution (200 mmol kg−1). The following cell compartments were analysed: soma, cell domain attached to the cell soma by one process (ROI1), cell process directly attached to the soma (ROI4) and two distant cell processes (ROI2, ROI3). The time of application of the hypotonic solution is indicated by the grey rectangle. Data were normalized and corrected for the decrease in the signal produced by photobleaching. Graphs were constructed using real-time relationships.

Similar articles

Cited by

References

    1. Aitken PG, Borgdorff AJ, Juta AJ, Kiehart DP, Somjen GG, Wadman WJ. Volume changes induced by osmotic stress in freshly isolated rat hippocampal neurons. Pflugers Arch. 1998;436:991–998. - PubMed
    1. Allansson L, Khatibi S, Gustavsson T, Blomstrand F, Olsson T, Hansson E. Single-cell volume estimation by three-dimensional wide-field microscopy applied to astroglial primary cultures. J Neurosci Meth. 1999;93:1–11. - PubMed
    1. Anděrová M, Antonova T, Petřík D, Neprašová H, Chvátal A, Syková E. Voltage-dependent potassium currents in hypertrophied rat astrocytes after a cortical stab wound. Glia. 2004;48:311–326. - PubMed
    1. Andrew RD, Lobinowich ME, Osehobo EP. Evidence against volume regulation by cortical brain cells during acute osmotic stress. Exp Neurol. 1997;143:300–312. - PubMed
    1. Ballanyi K, Grafe P, Serve G, Schlue WR. Electrophysiological measurements of volume changes in leech neuropile glial cells. Glia. 1990;3:151–158. - PubMed

Publication types

Substances

LinkOut - more resources