. 2007 May;12(5):699-712.
doi: 10.1016/j.devcel.2007.03.014.

GEF-H1 modulates localized RhoA activation during cytokinesis under the control of mitotic kinases

Affiliations

GEF-H1 modulates localized RhoA activation during cytokinesis under the control of mitotic kinases

Jörg Birkenfeld et al. Dev Cell. 2007 May.

Erratum in

  • Dev Cell. 2007 Jun;12(6):1007

Abstract

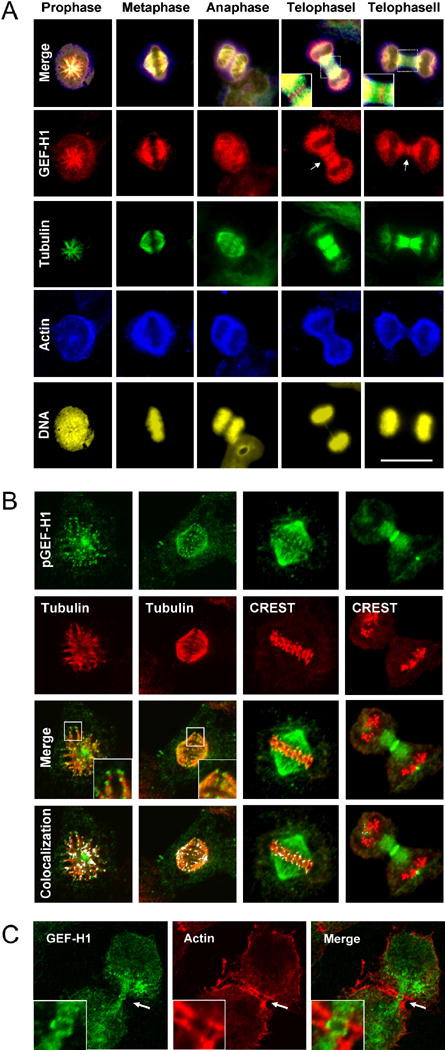
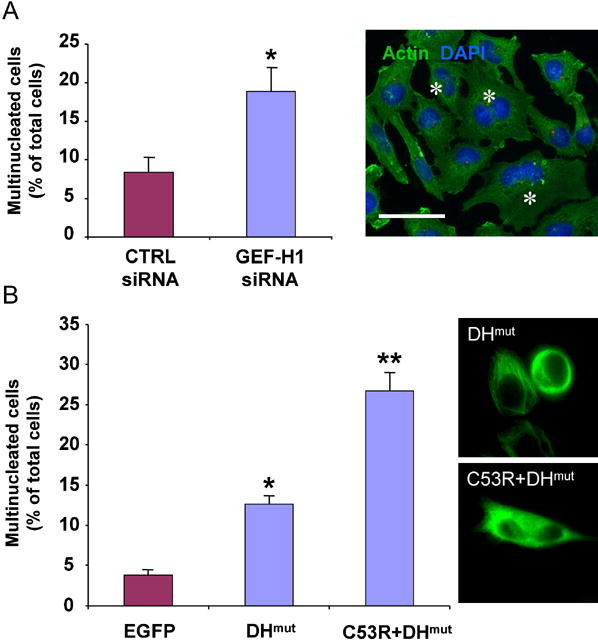
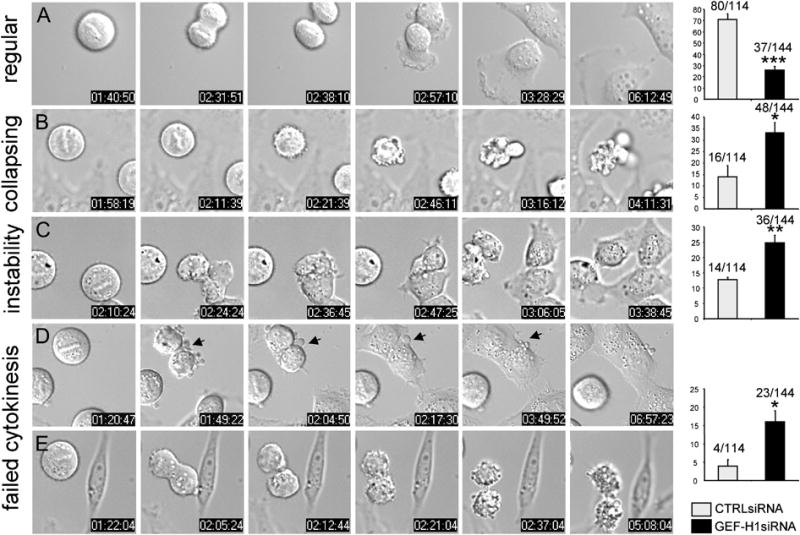
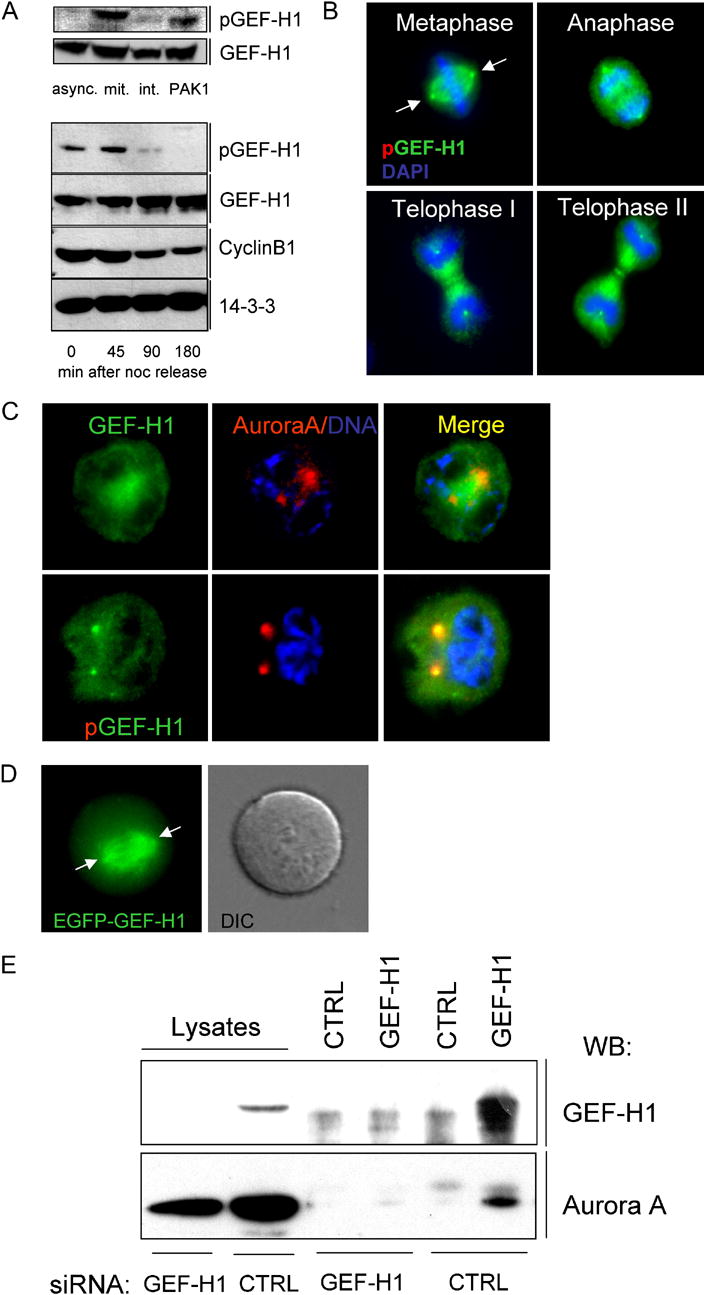
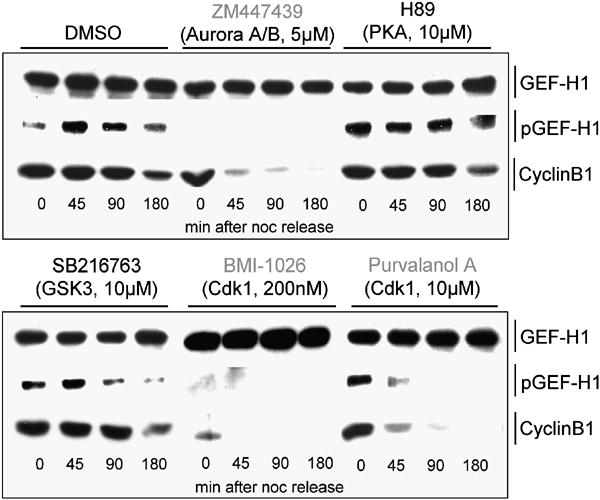
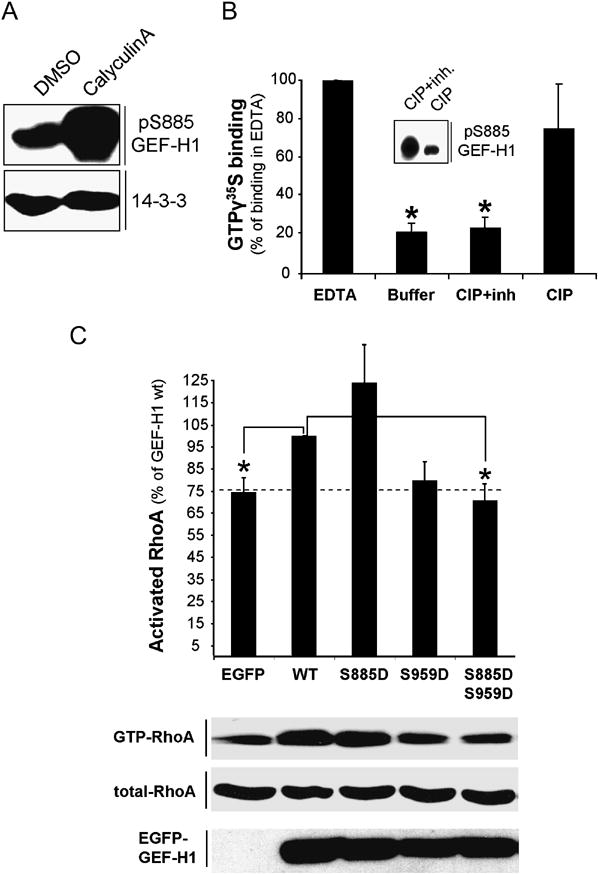
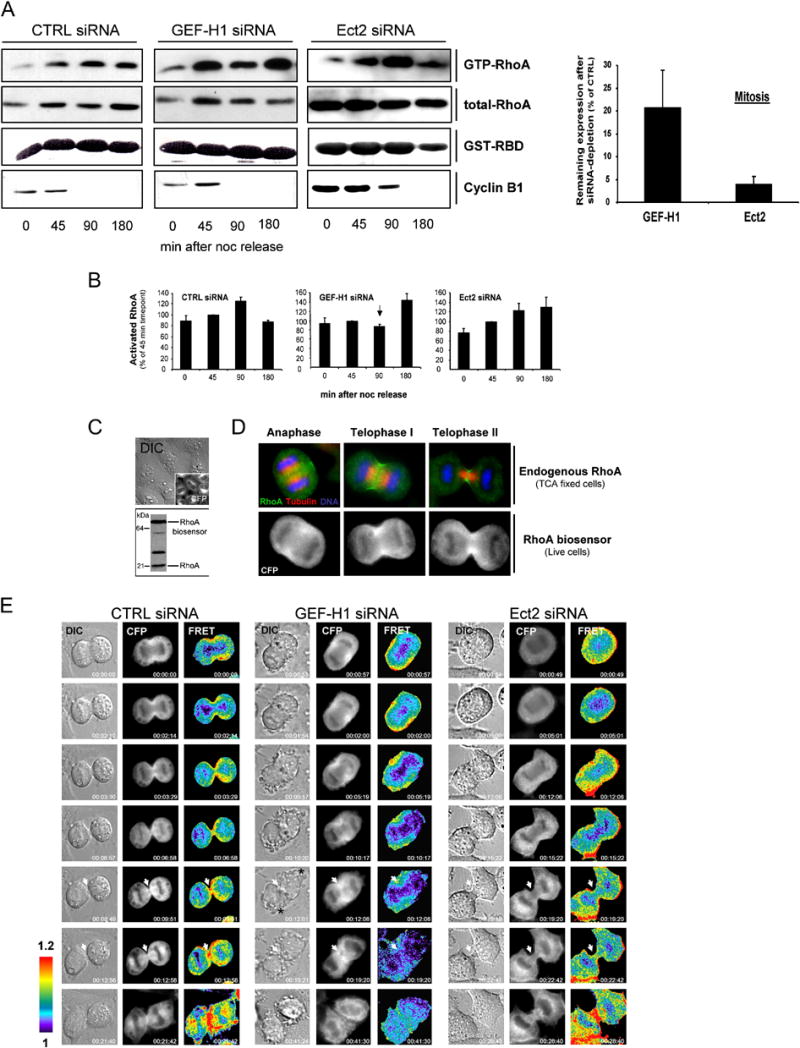
Formation of the mitotic cleavage furrow is dependent upon both microtubules and activity of the small GTPase RhoA. GEF-H1 is a microtubule-regulated exchange factor that couples microtubule dynamics to RhoA activation. GEF-H1 localized to the mitotic apparatus in HeLa cells, particularly at the tips of cortical microtubules and the midbody, and perturbation of GEF-H1 function induced mitotic aberrations, including asymmetric furrowing, membrane blebbing, and impaired cytokinesis. The mitotic kinases Aurora A/B and Cdk1/Cyclin B phosphorylate GEF-H1, thereby inhibiting GEF-H1 catalytic activity. Dephosphorylation of GEF-H1 occurs just prior to cytokinesis, accompanied by GEF-H1-dependent GTP loading on RhoA. Using a live cell biosensor, we demonstrate distinct roles for GEF-H1 and Ect2 in regulating Rho activity in the cleavage furrow, with GEF-H1 catalyzing Rho activation in response to Ect2-dependent localization and initiation of cell cleavage. Our results identify a GEF-H1-dependent mechanism to modulate localized RhoA activation during cytokinesis under the control of mitotic kinases.


Figures

Fig. 1
Fig. 1. Subcellular localization of endogenous GEF-H1 during mitosis
(A)GEF-H1 is associated with the spindle apparatus throughout mitosis. Asynchronous HeLa cells were fixed with methanol/acetone and quadruple-stained for endogenous GEF-H1 (red channel), tubulin (green channel), actin (blue channel) and DNA (yellow). Scale bar represents 20 μm. (B) GEF-H1 localizes to the tips of cortical MTs. Asynchronous HeLa cells were extracted for soluble tubulin, fixed as above and stained using anti-pGEF-H1 (green), anti-tubulin (red) antibodies or CREST serum. Boxed regions are shown in higher magnification. Confocal micrographs (single slices of 0.54 μm thickness) were analyzed for colocalized data points (displayed as white overlays in the colocalization panel). (C) During cytokinesis, GEF-H1 forms an equatorial ring encompassed by contractile actin structures. Confocal microscopy of mitotic HeLa cells stained with anti-GEF-H1 (green) and anti-actin (red) antibodies. Indicated regions (white arrows) are shown in higher magnification in the inserts.
Fig. 2
Fig. 2. Multinucleation caused by GEF-H1 perturbation
(A) Multinucleated cells were found at 48 h after transfection with GEF-H1 siRNA. Values shown are the means from four independent experiments in which over 1000 cells were counted per experiment; error bars indicate SEM. For statistical analysis, all data were evaluated by two-tailed Student’s t-test. Values significantly different from controls (p≤ 0.01) are marked with an asterisk. Cells harboring more than 1 nucleus are indicated by an asterisk in the micrograph. Scale bar represents 20 μm. (B) Overexpression of GEF-H1 inhibitory mutants induced multinucleation. The number of the multinucleated cells as a percentage of the total cell population expressing the EGFP-tagged constructs was quantified in HeLa cells 48 h after transfection. A minimum of 100 cells from each of three independent experiments was scored for each construct. Values significantly different from EGFP-expressing cells are marked with one (p≤0.01) or two asterisks (p ≤0.001). Micrographs on the right illustrate expression patterns of the different constructs.
Fig. 3
Fig. 3. Downregulation of GEF-H1 causes mitotic aberrations
Distribution of mitotic phenotypes in GEF-H1 (GEF-H1 siRNA) or control siRNA (CTRL siRNA)-transfected cells. Classification of phenotypes: a) regular cytokinesis; b) collapsing: cortical hyperactivity during metaphase, finally collapsing; c) instability: membranous aberrations around the CF w/o impairment of cytokinesis; d) failed cytokinesis: membranous aberrations during cytokinesis that are not compensated and gave rise to cytokinesis failure. Values are given as percentage of total cells with error bars indicating ± SEM. Actual numbers are indicated. In four independent experiments, a total of 144 GEF-H1-depleted and 114 control-depleted cells were scored (*≤ 0.05; **≤ 0.005; *** ≤0.0005).
Fig. 4
Fig. 4. Association of GEF-H1 with Aurora A
(A) Upper panel: GEF-H1 is phosphorylated at the onset of mitosis. HeLa cells were incubated with 100ng/ml noc for 16 h. Rounded mitotic cells, harvested by mechanical knock-off (mit.) and remaining adherent interphase cells (int.) were lysed and analyzed by immunoblotting with anti-pGEF-H1 or anti-GEF-H1 antibodies. Lysates from asynchronous (async.) or Pak1-transfected (PAK1; pSer885 control) HeLa cells were used as controls. Lower panel: Dephosphorylation of GEF-H1 during telophase/cytokinesis. HeLa cells were synchronized in mitosis by thymidine and noc, collected by knock-off and replated on poly-L-lysine-coated culture dishes. Lysates were analyzed by anti-pGEF-H1 or anti-GEF-H1 immunoblotting at the indicated time points. The degradation of Cyclin B was used as an additional marker for cell synchrony. 14-3-3 zeta controls were included to confirm comparable protein loading. (B) Immunolocalization of Ser885-phosphorylated GEF-H1 in mitotic cells. Asynchronous HeLa cells were fixed and stained for GEF-H1 (red channel), tubulin (green channel) and DNA (DAPI) as described in Fig.1. Scale bar represents 20 μm. (C) pGEF-H1 colocalizes with Aurora A in centrosomes. HeLa cells in prophase were co-stained for Aurora A (red channel) and either GEF-H1 or pGEF-H1 (green channels). DNA was detected by DAPI staining. Yellow color (merged image) indicates co-localization of pGEF-H1 with Aurora A in centrosomes. (D) Centrosome localization of EGFP-GEF-H1. HeLa cells were microinjected with plasmid DNA encoding EGFP-GEF-H1 and analyzed by time-lapse video fluorescence microscopy. Arrows indicate the position of the centrosomes. (E) GEF-H1 interacts with Aurora A in vivo. Immunoprecipitation of GEF-H1-depleted (GEF-H1 siRNA) or control-depleted (CTRL siRNA) mitotic lysates with either anti-GEF-H1 antibodies or control IgG after DSP crosslinking. The resulting immunoprecipitates were isolated, separated on SDS-PAGE, and immunoblotted with anti-Aurora A antibody. Lysate lanes shown represent ten percent of input lysate.
Fig. 5
Fig. 5. Phosphorylation of GEF-H1 by mitotic kinases Aurora A and Cdk1/Cyclin B
Inhibition of Aurora kinases and Cdk1/Cyclin B abolish GEF-H1 phosphorylation during mitosis. Before adherence, harvested synchronized HeLa cells were inhibitor treated for 15 min during release into fresh culture medium (w/o nocodazole) supplemented with the same inhibitors (at denoted concentrations and specificities). Inhibitors used here are specific for serine-threonine kinases that are either predicted by the Scansite algorithm (scansite.mit.edu) to phosphorylate GEF-H1 (PKA, GSK3β; data not shown) or are required for the control and timing of mitotic progression (Aurora A/B, Cdk1/Cyclin B) (Ferrari, 2006; Nigg, 2001). At the indicated times (after adherence), cells were lysed and analyzed by anti-pGEF-H1 and anti-GEF-H1 immunoblotting.
Fig. 6
Fig. 6. Dephosphorylation stimulates GEF-H1 enzymatic activity
(A) Calyculin A induces phosphorylation of GEF-H1 in vivo. HeLa cells were treated with 100nM Calyculin A or DMSO for 45 min. The amount of phospho-GEF-H1 in the different lysates was analyzed by immunoblotting with anti-pGEF-H1 antibodies. (B) Increase of GEF-H1 guanine nucleotide exchange activity in vitro after dephosphorylation. EGFP-GEF-H1 immunoprecipitates from Calyculin A-stimulated HeLa cells were treated with calf intestine alkaline phosphatase (CIP) in the presence (CIP+inh) or absence (CIP) of phosphatase inhibitors and subjected to in vitro GEF-assays as in Methods. The level of nucleotide binding in the presence of EDTA was set to 100%. pGEF-H1 levels in the immunoprecipitates after CIP treatment were analyzed by anti-pGEF-H1 immunoblotting (insert). Each value represents the mean (± SEM) of three independent experiments. Asterisk indicates values significantly different from EDTA controls (p≤ 0.0001). (C) Effects of GEF-H1 derivatives on accumulation of GTP-bound RhoA during mitosis. HeLa cells were transfected with the indicated EGFP-tagged expression vectors coding for different GEF-H1 mutants or EGFP alone for 24 h. Following a 15 h synchronization period with 100ng/ml noc, cells were released into fresh medium for 45min prior to lysis. Subsequently, the GTP-bound fraction of RhoA was extracted from the lysates by GST-RBD. The amount of RhoA bound to GST-RBD (GTP-RhoA) and the level of RhoA expression (total RhoA) in whole cell lysates was determined by immunoblotting using anti-RhoA antibodies. RhoA activation was expressed as percent activation relative to the EGFP-GEF-H1 wt-transfected control (set to 100%). Each datapoint represents the mean (± SEM) of at least three independent experiments. Asterisk indicates values significantly different from EGFP-GEF-H1wt controls (p ≤0.01). The dashed line marks the level of GTP-RhoA in EGFP-expressing cells. All values were normalized for expression efficiency of the individual constructs (anti-EGFP immunoblotting) and total RhoA levels by densitometric analysis as in (A). PonceauS staining was used to determine the amount of GST-RBD in the reaction.
Fig. 7
Fig. 7. GEF-H1 modulates RhoA activation in mitotic cells
(A + B) Cell cycle-associated changes in the level of GTP-RhoA after GEF-H1 depletion. Synchronized HeLa cells were subjected to GST-RBD pull down assays to detect GTP-RhoA during different stages of mitosis in lysates depleted of GEF-H1, Ect2 or control-depleted lysates. A representative experiment is shown in (A). At least four independent assays for each condition were used to quantify the activation profile of RhoA as inFig. 6D (B). The amount of GTP-RhoA at 45 min after noc release was set to 100%. All values were normalized for the total amount of RhoA. Error bars indicate ± SEM. (A; graph) The remaining expression of GEF-H1 and Ect2 in the mitotic lysates was quantitated densitometrically after immunoblotting and normalized to CTRL-siRNA treated cells. Values represent the mean of four independent determinations ±SEM. Note that Ect2 ablation was more efficient than depletion of GEF-H1. (C) HeLa cells stably transfected with a FRET-based RhoA biosensor were analyzed for expression of the latter by live microscopy (upper panels; CFP channel) and immunoblotting of respective lysates using anti-RhoA antibodies (lower panel). Biosensor expression was ~2-fold increased over endogenous RhoA levels as determined by densitometric analysis. (D) Localization of the RhoA biosensor in live cells during cytokinesis. The subcellular distribution of the RhoA biosensor in live cells (CFP panel) was compared to that of endogenous RhoA in TCA-fixed cells during different stages of mitosis. Fixed cells were stained with anti-RhoA (green) and anti-tubulin (red) antibodies and DAPI (blue) for DNA. (E) RhoA activation patterns during cytokinesis. HeLa cells stably expressing the RhoA biosensor were transfected with the indicated siRNAs for 30 h before progression through cytokinesis was analyzed by DIC microscopy and FRET/CFP ratio imaging to represent FRET efficiency (FRET). The localization of the biosensor is shown in the CFP channel. FRET pictures denote activation patterns of the biosensor. All images are processed and scaled identically so that regions of intense RhoA activity are shown in red. The elapsed time is denoted at the bottom right corners of each picture. A representative image of at least 6 similar images acquired for each condition is shown. White arrows indicate equatorial regions with high RhoA activation in CTRL-depleted cells and reduced RhoA activation in GEF-H1 and Ect2 siRNA-treated cells during late stages of cytokinesis. Asterisks indicate regions of aberrant membrane activities in cells treated with GEF-H1 siRNA.

Comment in

  • Cytokinetic pyrotechnics.
    Bement WM. Bement WM. Dev Cell. 2007 May;12(5):663-4. doi: 10.1016/j.devcel.2007.04.010. Dev Cell. 2007. PMID: 17488616

References

    1. Alsop GB, Zhang D. Microtubules continuously dictate distribution of actin filaments and positioning of cell cleavage in grasshopper spermatocytes. J Cell Sci. 2004;117:1591–1602. - PubMed
    1. Andrews PD, Knatko E, Moore WJ, Swedlow JR. Mitotic mechanics: the auroras come into view. Curr Opin Cell Biol. 2003;15:672–683. - PubMed
    1. Bakal CJ, Finan D, LaRose J, Wells CD, Gish G, Kulkarni S, DeSepulveda P, Wilde A, Rottapel R. The Rho GTP exchange factor Lfc promotes spindle assembly in early mitosis. Proc Natl Acad Sci U S A. 2005;102:9529–9534. - PMC - PubMed
    1. Bement WM, Benink HA, von Dassow G. A microtubule-dependent zone of active RhoA during cleavage plane specification. J Cell Biol. 2005;170:91–101. - PMC - PubMed
    1. Bringmann H. Cytokinesis and the spindle midzone. Cell Cycle. 2005;4:1709–1712. - PubMed

Publication types

MeSH terms

Substances