. 2007 Sep 1;365(2):419-34.
doi: 10.1016/j.virol.2007.04.001. Epub 2007 May 8.

Porcine reproductive and respiratory syndrome virus induces apoptosis through a mitochondria-mediated pathway

Affiliations

Porcine reproductive and respiratory syndrome virus induces apoptosis through a mitochondria-mediated pathway

Sang-Myeong Lee et al. Virology. .

Abstract

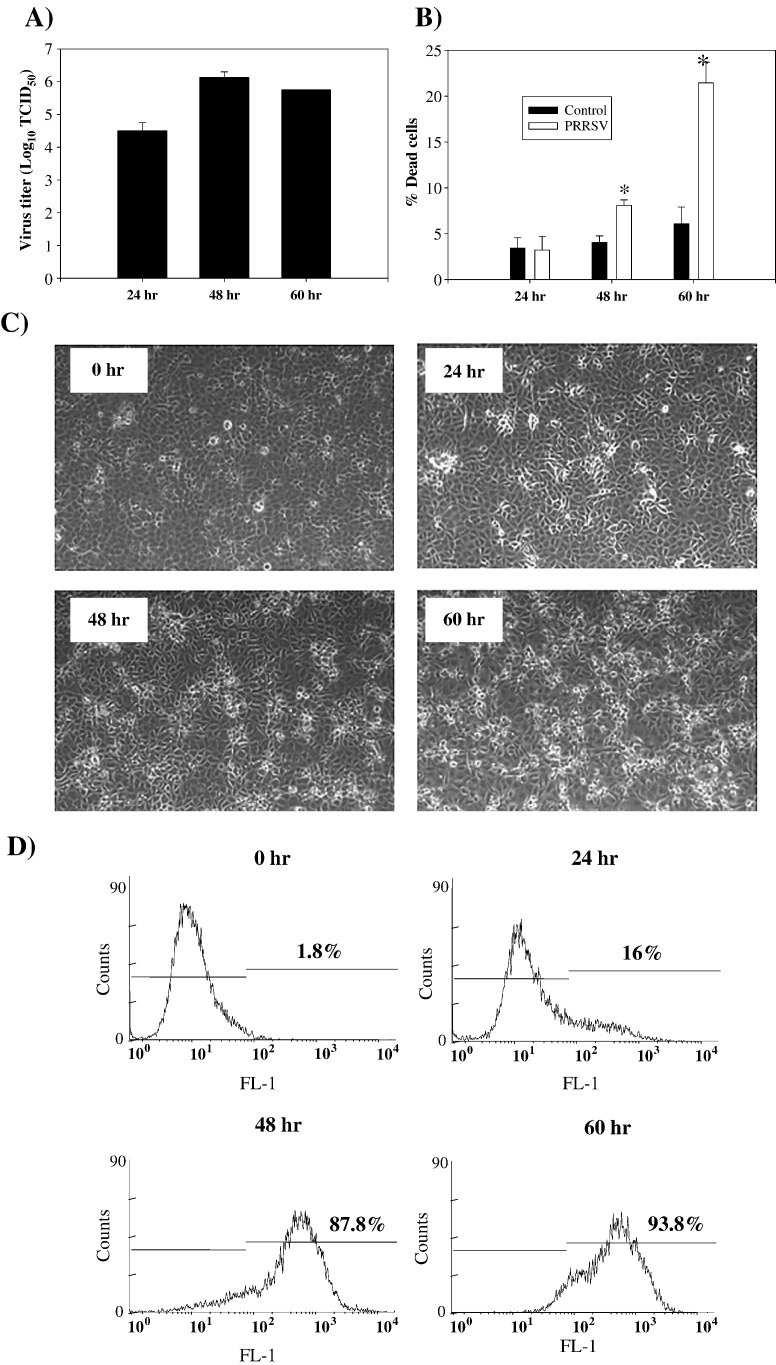
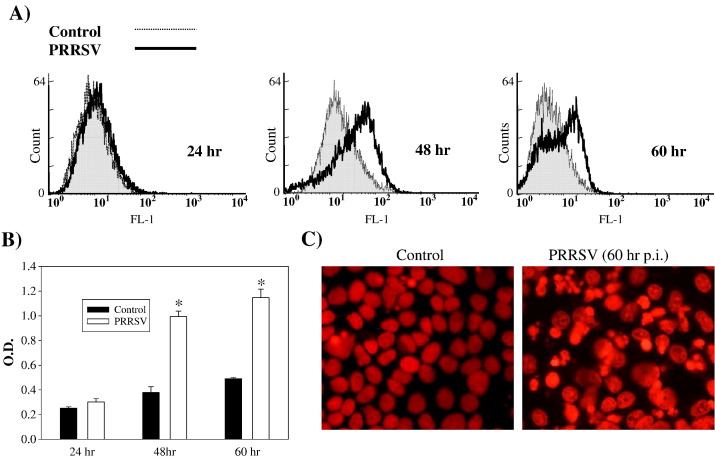
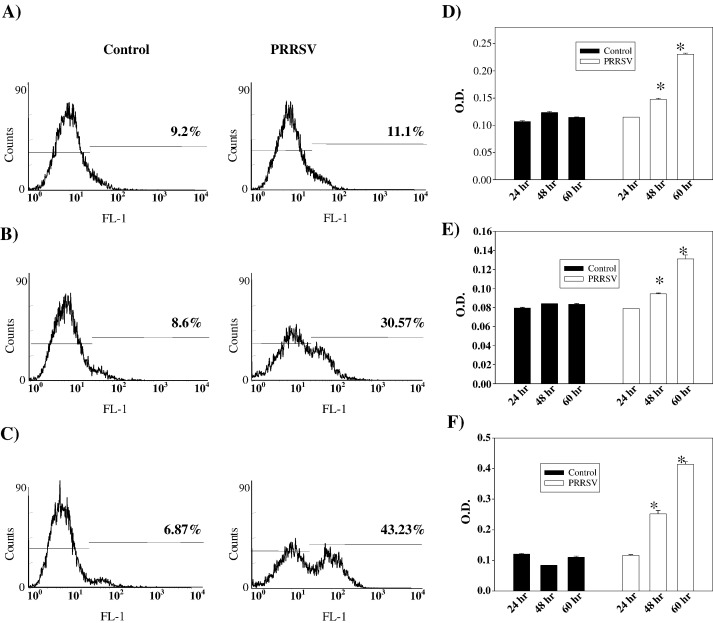
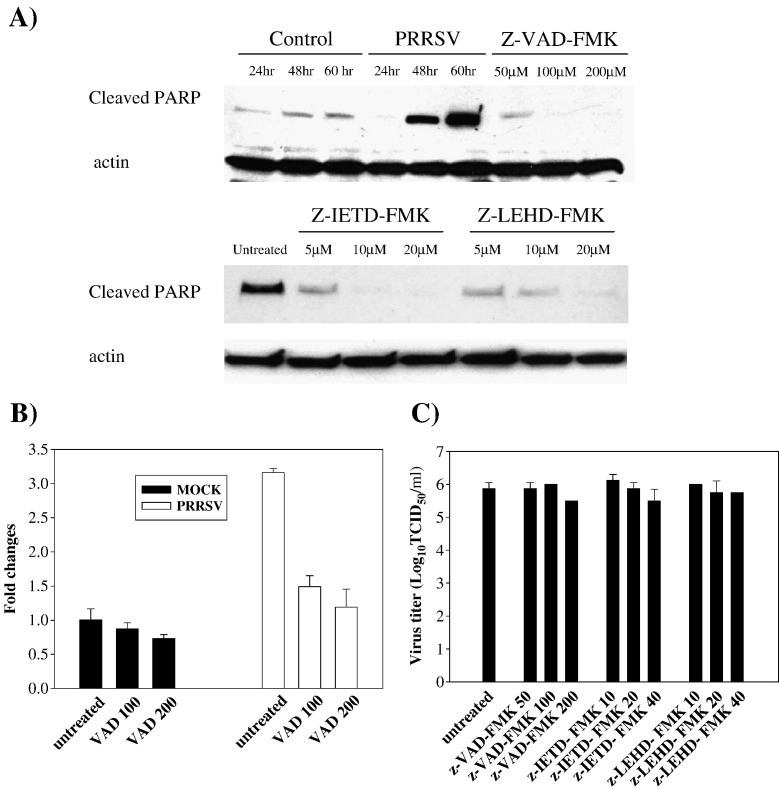
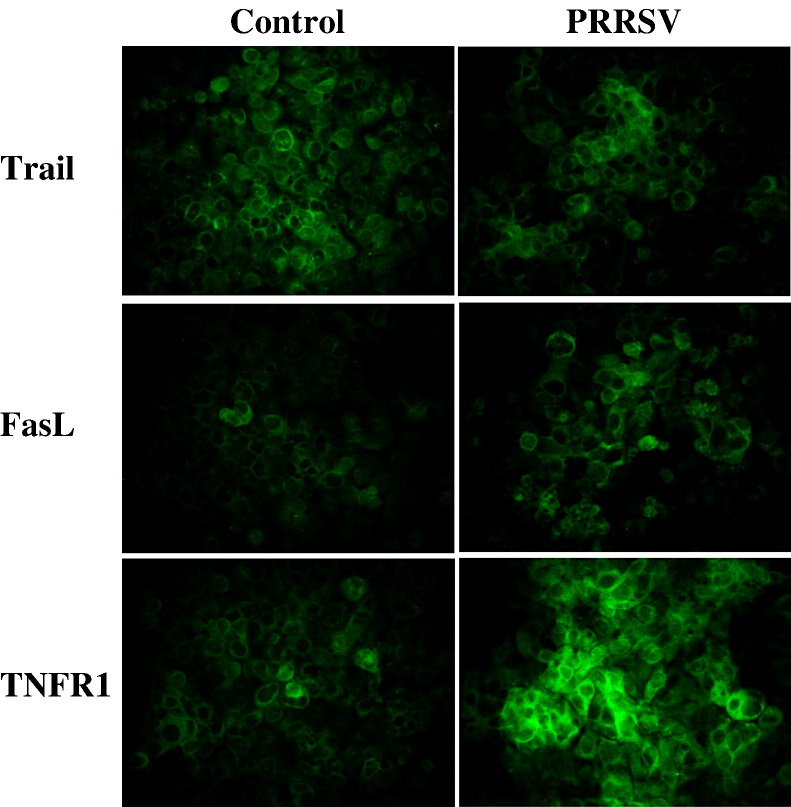
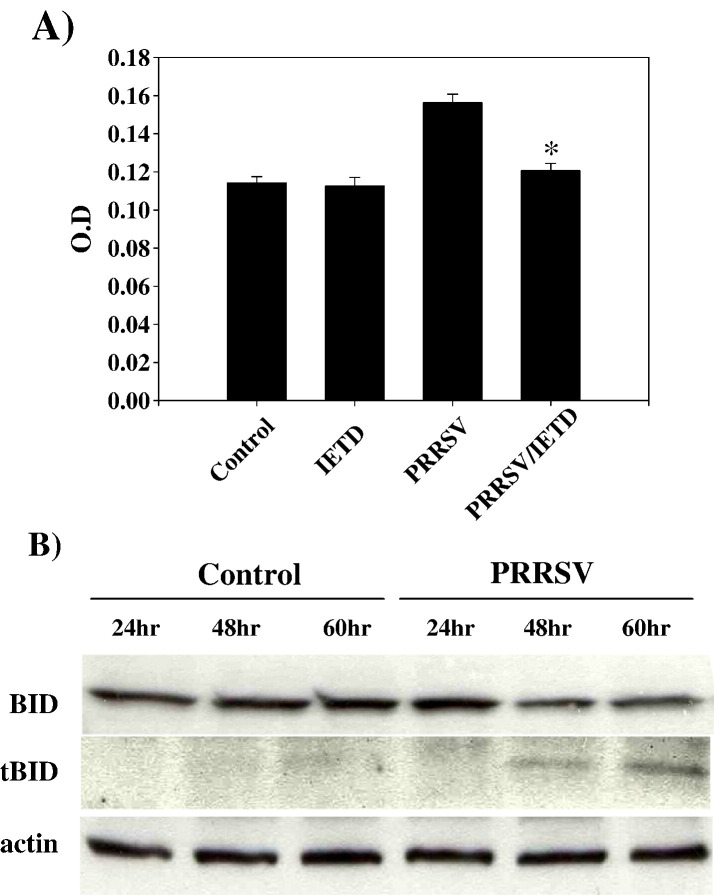
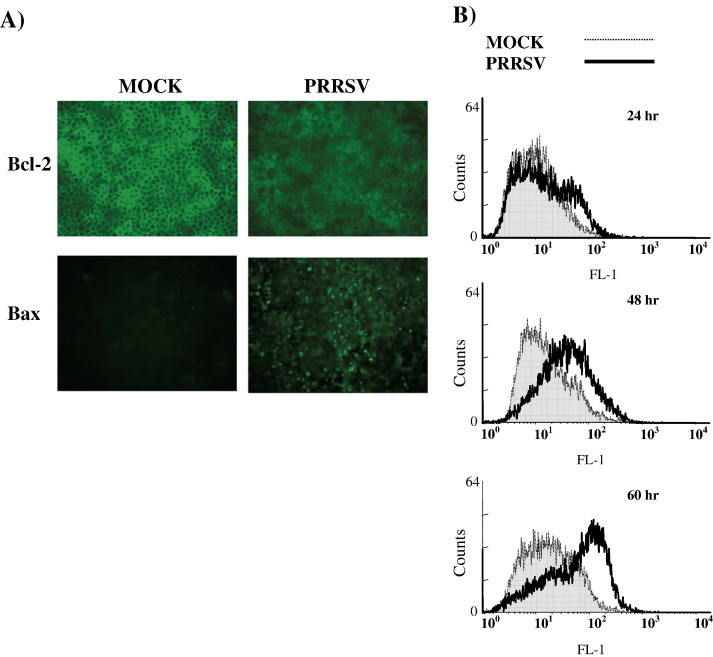
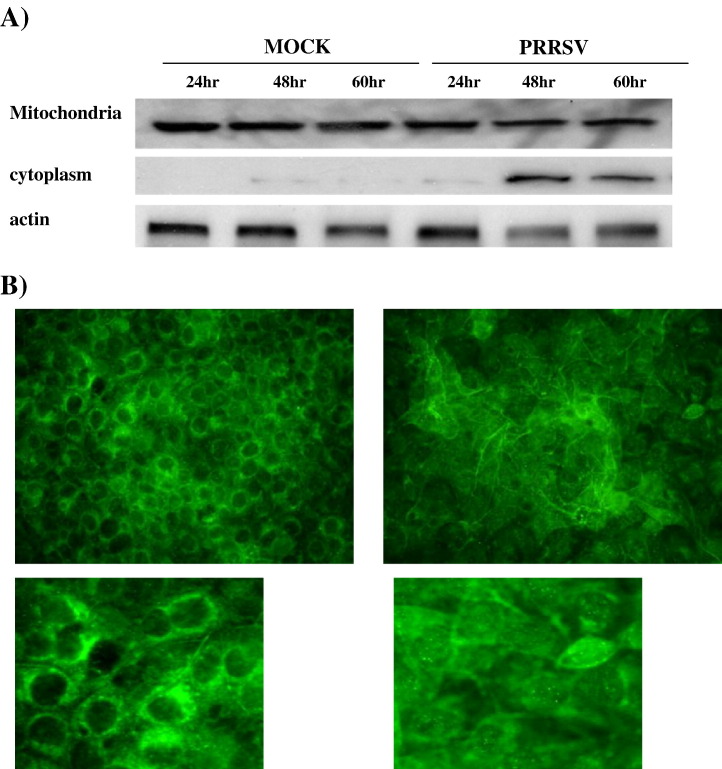
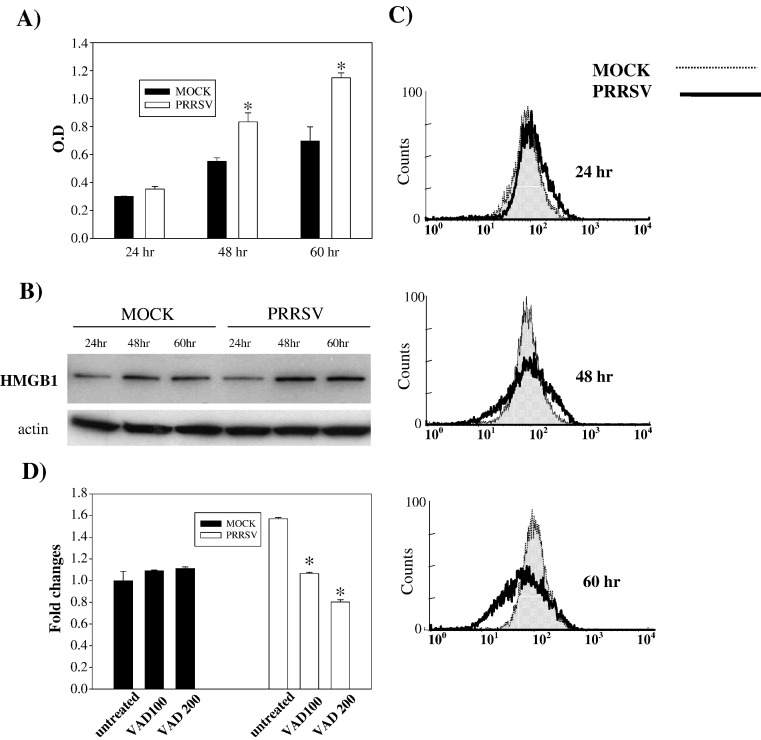
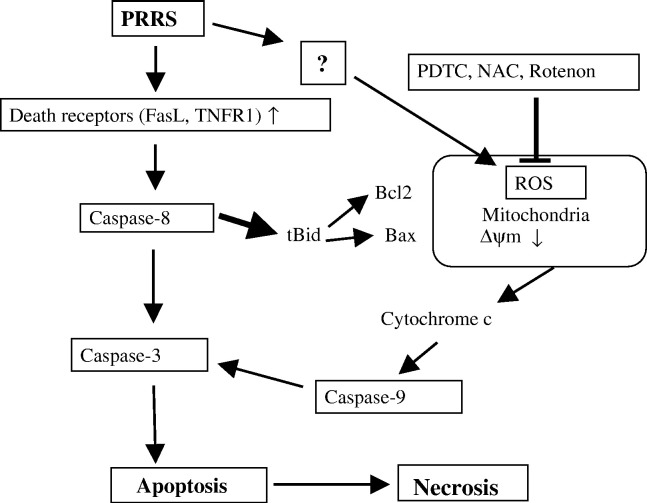
As with a number of other viruses, Porcine reproductive and respiratory syndrome virus (PRRSV) has been shown to induce apoptosis, although the mechanism(s) involved remain unknown. In this study we have characterized the apoptotic pathways activated by PRRSV infection. PRRSV-infected cells showed evidence of apoptosis including phosphatidylserine exposure, chromatin condensation, DNA fragmentation, caspase activation (including caspase-8, 9, 3), and PARP cleavage. DNA fragmentation was dependent on caspase activation but blocking apoptosis by a caspase inhibitor did not affect PRRSV replication. Upregulation of Bax expression by PRRSV infection was followed by disruption of the mitochondria transmembrane potential, resulting in cytochrome c redistridution to the cytoplasm and subsequent caspase-9 activation. A crosstalk between the extrinsic and intrinsic pathways was demonstrated by dependency of caspase-9 activation on active caspase-8 and by Bid cleavage. Furthermore, in this study we provide evidence of the possible involvement of reactive oxygen species (ROS)-mediated oxidative stress in apoptosis induced by PRRSV. Our data indicated that cell death caused by PRRSV infection involves necrosis as well as apoptosis. In summary, these findings demonstrate mechanisms by which PRRSV induces apoptosis and will contribute to an enhanced understanding of PRRSV pathogenesis.


Figures

Fig. 1
Fig. 1
Infection of MARC-145 cells with PRRSV. (A) MARC-145 cells were infected with PRRSV at MOI = 0.1 and cell culture medium was collected at the indicated time points p.i, with each time point represented by triplicate samples. Samples were frozen − 80 °C and thawed one time, and infectious virus titers were analyzed in MARC-145 cells using the Reed and Muench method (Reed and Muench, 1938). Values are shown as the mean ± SD from triplicate wells, and this experiment was repeated twice with consistent results. (B) Cell viability of mock or PRRSV-infected MARC-145 cells were determined at 24, 48, and 60 h p.i. using trypan blue exclusion assay. Values are shown as the mean ± SD from triplicate wells, and this experiment was repeated twice with consistent results. (C) PRRSV-infected MARC-145 cells were fixed in methanol 24, 48, and 60 h p.i. and observed under phase contrast microscope. (D) PRRSV-infected MARC-145 cells were harvested at 24, 48, and 60 h p.i. and fixed with 2% PFA and permeabilized with 70% ethanol. After washing with PBS, cells were stained with SDOW-17 antibody against the PRRSV nucleocapsid protein followed by anti-mouse-FITC conjugate. FITC positive cells were analyzed by flow cytometry in the FL-1 channel. X-axis represents log10 fluorescent intensity and Y axis shows cell counts. *; P < 0.001 compared to mock-infected cells at the same time point.
Fig. 2
Fig. 2
Apoptosis in PRRSV-infected cells. (A) Adherent cells were harvested by trypsin treatment and combined with floating cells. Then cells were stained with annexin V–flour staining kit followed by flow cytometry analysis. (B) Cells infected with PRRSV were lysed at 24, 48, and 60 h p.i. DNA fragments in cell lysates were quantitatively measured using the DNA fragmentation ELISA. Values are shown as the mean ± SD of the optical density (O.D.) values from duplicate wells, and these results are representative of three independent experiments. (C) Chromatin condensation was visualized in MARC-145 cells fixed with ice-cold methanol and stained with PI solution containing RNaseA. *; P < 0.001 compared to mock-infected cells at the same time point.
Fig. 3
Fig. 3
PRRSV infection activates caspases. Both adherent and floating cells were labeled with FITC-conjugated z-VAD-FMK at 24 h (A), 48 h (B), and 60 h (C) p.i. as described in Materials and methods. The percentage of positive cells is indicated in each panel. These results are representative of three independent experiments. Caspase-8 (D), caspase-9 (E), and caspase-3 (F) activities of mock or PRRSV-infected cells were determined at the indicated times p.i. Cytoplasmic extracts from both adherent and floating cells were prepared and analyzed for each caspase activity using a colorimetric assay with specific substrate for each caspase. Results are expressed as O.D. values from 100 μg of protein. ELISAs were performed in triplicate, and values are shown as mean ± SD. These results are representative of at least three independent experiments. *; P < 0.05 compared to mock-infected cells at the same point.
Fig. 4
Fig. 4
PRRSV triggered PARP cleavage and DNA fragmentation which were caspase-dependent. (A) The level of cleaved PARP was monitored by Western blot. Cells were infected with PRRSV and treated with caspase inhibitors, z-VAD-FMK, z-IETD-FMK, and z-LEHD-FMK. Whole cell extracts from both adherent and floating cells were then prepared at 24, 48, or 60 h p.i. for untreated cells and 60 h p.i. for caspase-inhibitor-treated cells and immunoblotted with cleavage site specific anti-PARP polyclonal antibody. A representative result from three independent experiments is shown. Following infection, cells were treated with z-VAD-FMK and the DNA fragmentation ELISA was performed with cytoplasmic extracts (B) from indicated time points p.i. These results are representative of at least three independent experiments. *; P < 0.001 compared to untreated PRRSV-infected cells. (C) Infectious virus titers in cell culture medium were determined at 60 h p.i. and virus titers are shown as log10 TCID50/ml. All experiments were repeated three times with similar results.
Fig. 5
Fig. 5
PRRSV increases cell surface expression of TNFR1 and FasL but not Trail. Cells were fixed and stained for TNFR1, Trail, and FasL at 60 h p.i. and observed under by fluorescence microscopy.
Fig. 6
Fig. 6
Caspase-9 activity is dependent on caspase-8 activation and tBID expression is increased in PRRSV-infected cells. (A) Cells were infected with PRRSV and treated with the caspase-8 inhibitor, z-IETD-FMK at 20 μM. Adherent cells were harvested by trypsin treatment and combined with floating cells. Caspase-9 activity was measured using a colorimetric assay with a specific substrate. Values are shown as the means ± SD from triplicate wells and represent two independent experiments. (B) Cell lysates from both adherent and floating cells at different time points after PRRSV infection were immunoblotted and truncated BID was detected. This experiment was repeated two times with similar results. *; P < 0.001 compared to untreated PRRSV-infected cells.
Fig. 7
Fig. 7
Effect of PRRSV infection on Bcl-2 and Bax expression and on mitochondrial transmembrane potential. (A) Cells infected with PRRSV were fixed and permeabilized at 60 h p.i. and then stained for Bcl-2 and Bax. Slides were observed by fluorescence microscopy. (B) Cells infected with PRRSV (both adherent and floating cells) were collected and examined for disruption of mitochondrial transmembrane potential by using the fluorescent probe MitoCapture. MitoCapture-labeled cells were analyzed by flow cytometry.
Fig. 8
Fig. 8
PRRSV causes the release of cytochrome c from mitochondria. (A) The level of cytochrome c in mitochondria and cytoplasm was monitored by immunoblotting of mitochondrial extracts and cytoplasmic extracts from both adherent and floating cells. (B) Cytochrome c was visualized by IFA using monoclonal antibody specific for cytochrome c. These results are representative of two independent experiments.
Fig. 9
Fig. 9
Antioxidants prevented PARP cleavage caused by PRRSV. Cells were either mock-infected or infected with PRRSV and then treated with PDTC, NAC, and RTN at the indicated concentrations. (A) After 60 h induction, adherent cells were harvested by trypsin treatment and combined with floating cells. Whole cell extracts were prepared and then immunoblotted with a monoclonal antibody specific for cleaved PARP. A representative blot from three independent experiments is shown. (B) At 60 h p.i. the DNA fragmentation ELISA was performed with samples from triplicate wells. The ELISA was preformed in duplicate and values are shown as mean ± SD. All experiments were repeated at least two times with similar results. #; P < 0.001 compared to untreated PRRSV-infected cells.
Fig. 10
Fig. 10
PRRSV-infected cells show characteristics of necrosis. (A) The amount of DNA fragmentation in the cell culture medium was determined at the indicated time points using a DNA fragmentation ELISA. The ELISA was performed in duplicate and values are shown as mean ± SD. These results are representative of three independent experiments. *; P < 0.001 compared to mock-infected cells at the same point. (B) Cytoplasmic extracts from mock- or PRRSV-infected cells (both adherent and floating cells) were immunoblotted with polyclonal anti-HMGB1 antibody. HMGB1 protein was identified as a 29 kDa band. (C) Both adherent and floating cells were collected and fixed with 4% PFA followed by permeabilization with ice-cold ethanol. Cells were incubated with polyclonal anti-HMGB1 antibody followed by a secondary antibody conjugated with FITC. Cell-associated HMGB1 in cells was analyzed by flow cytometry. (D) Following infection, cells were treated with z-VAD-FMK and a DNA fragmentation ELISA was performed with cell culture supernatants from the indicated time points p.i. These results are representative of three independent experiments. *; P < 0.001 compared to untreated PRRSV-infected cells.
Fig. 11
Fig. 11
Schematic representation of PRRSV-induced apoptosis pathways.

References

    1. Akaike T. Role of free radicals in viral pathogenesis and mutation. Rev. Med. Virol. 2001;11(2):87–101. - PMC - PubMed
    1. Andersson U., Tracey K.J. HMGB1 as a mediator of necrosis-induced inflammation and a therapeutic target in arthritis. Rheum. Dis. Clin. North Am. 2004;30(3):627–637. (xi) - PubMed
    1. Ashkenazi A., Dixit V.M. Death receptors: signaling and modulation. Science. 1998;281(5381):1305–1308. - PubMed
    1. Bartz S.R., Emerman M. Human immunodeficiency virus type 1 Tat induces apoptosis and increases sensitivity to apoptotic signals by up-regulating FLICE/caspase-8. J. Virol. 1999;73(3):1956–1963. - PMC - PubMed
    1. Bitzer M., Prinz F., Bauer M., Spiegel M., Neubert W.J., Gregor M., Schulze-Osthoff K., Lauer U. Sendai virus infection induces apoptosis through activation of caspase-8 (FLICE) and caspase-3 (CPP32) J. Virol. 1999;73(1):702–708. - PMC - PubMed