. 2007 May;97(5):3790-9.
doi: 10.1152/jn.01241.2006.

Ih without Kir in adult rat retinal ganglion cells

Affiliations

Ih without Kir in adult rat retinal ganglion cells

Sherwin C Lee et al. J Neurophysiol. 2007 May.

Abstract

Antisera directed against hyperpolarization-activated mixed-cation ("I(h)") and K(+) ("K(ir)") channels bind to some somata in the ganglion cell layer of rat and rabbit retina. Additionally, the termination of hyperpolarizing current injections can trigger spikes in some cat retinal ganglion cells, suggesting a rebound depolarization arising from activation of I(h). However, patch-clamp studies showed that rat ganglion cells lack inward rectification or present an inwardly rectifying K(+) current. We therefore tested whether hyperpolarization activates I(h) in dissociated, adult rat retinal ganglion cell somata. We report here that, although we found no inward rectification in some cells, and a K(ir)-like current in a few cells, hyperpolarization activated I(h) in roughly 75% of the cells we recorded from in voltage clamp. We show that this current is blocked by Cs(+) or ZD7288 and only slightly reduced by Ba(2+), that the current amplitude and reversal potential are sensitive to extracellular Na(+) and K(+), and that we found no evidence of K(ir) in cells presenting I(h). In current clamp, injecting hyperpolarizing current induced a slowly relaxing membrane hyperpolarization that rebounded to a few action potentials when the hyperpolarizing current was stopped; both the membrane potential relaxation and rebound spikes were blocked by ZD7288. These results provide the first measurement of I(h) in mammalian retinal ganglion cells and indicate that the ion channels of rat retinal ganglion cells may vary in ways not expected from previous voltage and current recordings.


Figures

Figure 1
Figure 1. Leak, Ba2+-blocked, and Cs+-blocked currents
Whole-cell current in three different cells (A, B, C) at the voltages shown schematically at the top of A, while the following solutions were superfused over them. Control (A1), then control supplemented with 1 mM CsCl (A2). Control (B1), then control supplemented with 100 μM BaCl2 (B2). Control (C1), control supplemented with 1 mM BaCl2 (C2), control supplemented with 1 mM BaCl2 and 2 mM CsCl (C3), control (C4). In panels A1 and A2, the holding potential was -78 mV; in all other panels, the holding potential was -73 mV. The test potentials were -83 to -123 mV in 10-mV decrements for all cells; in C, the current at -73 mV is also shown. No leak subtraction was used. Time and amplitude are calibrated by the scale bars to the right of A, B, and C. Currents from each cell plotted relative to same zero current level; arrowhead in B marks -20 pA for A and B; that in C marks -60 pA. C5 plots the Cs+-blocked current from digitally subtracting the traces in C3 from those in C2 (see Fig. 2 for calibrations). Note in B2 that Ba2+ blocked current that is both inwardly rectifying and rapidly gating in B1, Cs+ blocked the inwardly rectifying and slowly gating current in C2 (C3), and pre-Cs+ amplitude and kinetics were recovered almost completely by washing with control solution (C4).
Figure 2
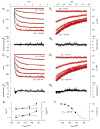
Figure 2. Time constants of activation and deactivation
A1 shows the Cs+-blocked current (red) during the 3 s spent at each test potential (“Et”, ranging from -73 to -123 mV) in Fig. 1C5, with best fits of a biexponential time function superimposed over each (black; see text). B1 shows the Cs+-blocked current (red) during the first 1.00 s after each test potential terminated in Fig. 1C5. Best biexponential fits to each 6-s epoch of deactivation at the holding potential in Fig. 1C5 are superimposed (in black). C1 and D1 plot the same current segments as A1 and B1 (red), with best fits of monoexponential time functions to the same 3-s activation and 6-s deactivation epochs. For each panel (A1-D1), times shown on abscissa match those of currents in Fig 1C, and residuals between the current traces and fits at -123 mV are plotted in A2, B2, C2, and D2, respectively. E plots time constants of activation and deactivation versus test potential. Means from biexponential fits to the gradual (as opposed to instantaneous) increase (filled symbols) and decrease (open symbols) of Cs+-blocked current amplitude from all cells (n=5 for biexponential activation, 3 for biexponential deactivation; see text). Lines drawn through each set of points are linear regressions. Fast (●) and slow (▼) activation time constants change exponentially with voltage. Fast (○) and slow (▽) deactivation time constants are roughly constant over the same voltage range. F plots mean of the amplitudes of tail component of Cs+-blocked current from each cell in E, when they were repolarized from test potential (abscissa) to the holding potential (-73 mV). Amplitudes back-extrapolated to the moment of repolarization by best fit of mono- or bi-exponential function to deactivation (see text), and normalized to the largest amplitude recorded from each cell. The error bars not visible in E and F are within the symbols.
Figure 3
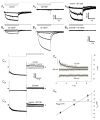
Figure 3. Ih in normal saline, high [K+]o, and low [Na+]o
Whole-cell current in three different cells (A, B, C) while the following solutions were superfused over them. A1: normal (3.5 K+ mM); A2: normal supplemented with 100 μM ZD7288. B1: 3.5 mM K+; B2: high K+ (38 mM); B3: high K+ supplemented with 100 μM ZD7288. C1: low Na+ (7.4 mM Na+, normal K+), C2: low Na+ supplemented with 100 μM ZD7288. Voltage protocols shown above each set of currents. Time and amplitude calibrations for each cell shown at right side of A2, B3, and C1, respectively. Holding potential is -73 mV in all panels of A and B. Test potentials are -78, -88, and -98 mV in A; -68, -78, -88, and -98 mV in B. For comparison, dotted line positioned at the control holding current and extended across other currents traces in A (-58 pA) and B (-35 pA). Note that ZD7288 blocks time-dependent current, and reduces time-independent current, in normal and high [K+]o. A3: Ih in normal saline obtained by subtracting the currents in A2 from those in A1, and plotted at higher gain than A1. Panels C1 and C2 plot the total current recorded at three test potentials (-90, -80, then -70 mV) after hyperpolarizing from -80 mV to -120 mV (protocol at top of C1). C3 plots Ih in low [Na+]o, obtained by subtracting the currents in C2 from those in C1. The arrowheads in C1, C2, and C3 mark the 0 pA level. C4 superimposes biexponential fits (black) over the Ih tail currents (grey) from C3. The times on the abscissa are those in C3 (where each sweep begins at t=0). The tail current amplitude is the maximum of these fits for outward tails (at -70 mV), and the minimum for inward tails (at -90 and -80 mV). C5 plots the mean±SE of the tail current amplitudes from all cells tested (n=3). The linear regression on these points crosses the abscissa at -78 mV. Low [Na+]o experiments were done in the presence of 1 μM TTX to block activation of voltage-gated Na+ current.
Figure 4
Figure 4. Rebound spikes elicited by activation of Ih and block by ZD7288
Whole-cell voltage- and current-clamp in two different cells (A-C and D-F). In all cases, panels with subscript 1 are control, and panels with subscript 2 are in the presence of 100 μM (A-C) or 5 μM (D-F) ZD7288. In voltage-clamp, the voltage protocol shown schematically at the top of A and D (steps from holding potential -73 mV to -68, -83, -93, -103, -113 and -123 mV) was used to activate Ih (A1, D1). After switching to current-clamp, spiking was elicited by 0.5-s injections of depolarizing current (21 pA in C, 30 pA in F). Then, each cell received 0.5-s injections of hyperpolarizing current that produced characteristic activation of inward current and a depolarizing sag of the membrane potential (B1, E1). When the hyperpolarizing current step was turned off, membrane potential rebounded, and elicited a short series of spikes (B1, E1). Blocking Ih by the introduction of ZD7288 removed the depolarizing sag and prevented rebound spikes (B2, E2). ZD7288 also produced an apparent increase in membrane resistance, leading to a negative shift in membrane potential at constant holding current and larger voltage deflections in response to the injection of hyperpolarizing current. For the 1st cell, a -60 pA step produced the voltage pattern in B1, while -28 pA was sufficient to induce a similar hyperpolarization in B2 after Ih was blocked. For the 2nd cell, the same -35 pA step was used in both E1 and E2, but hyperpolarization was much greater in the presence of ZD7288. Membrane resistance in the depolarizing direction was less affected, and ZD7288 had minimal effect on spiking induced by depolarizing current steps (compare C1, C2 and F1, F2). Small residual hyperpolarization-activated current persists in D2 and E2 because 5 μM ZD7288 does not produce 100% inhibition of Ih. Arrowheads in A and D indicate 0 current. Initial membrane potential for each cell in current clamp was ca. -76 mV (B1, C1) and -74 mV (E1, F1).

Similar articles

Cited by

References

    1. Akamine T, Nishimura Y, Ito K, Uji Y, Yamamoto T. Effects of haloperidol on K+ currents in acutely isolated rat retinal ganglion cells. Invest Ophthalmol Vis Sci. 2002;43:1257–1261. - PubMed
    1. Akopian A, Witkovsky P. D2 dopamine receptor-mediated inhibition of a hyperpolarization-activated current in rod photoreceptors. J Neurophysiol. 1996;76:1828–1835. - PubMed
    1. Ames A, 3rd, Nesbett FB. In vitro retina as an experimental model of the central nervous system. J Neurochem. 1981;37:867–877. - PubMed
    1. Barres BA, Silverstein BE, Corey DP, Chun LL. Immunological, morphological, and electrophysiological variation among retinal ganglion cells purified by panning. Neuron. 1988;1:791–803. - PubMed
    1. Bayliss DA, Viana F, Bellingham MC, Berger AJ. Characteristics and postnatal development of a hyperpolarisation-activated inward current in rat hypoglossal motoneurones in vitro. J Neurophysiol. 1994;71:119–128. - PubMed

Publication types

MeSH terms

LinkOut - more resources