

Improving quality assessment through multilevel modeling: the case of nursing home compare
- PMID: 17489909
- PMCID: PMC1955250
- DOI: 10.1111/j.1475-6773.2006.00647.x
Improving quality assessment through multilevel modeling: the case of nursing home compare
Abstract
Objective: To demonstrate how multilevel modeling and empirical Bayes (EB) estimates can improve Medicare's Nursing Home Compare quality measures (QMs).
Data sources/study setting: Secondary data from July 1 to September 30, 2004. Facility-level QMs were estimated from minimum data set (MDS) assessments for approximately 31,000 Minnesota nursing home residents in 393 facilities.
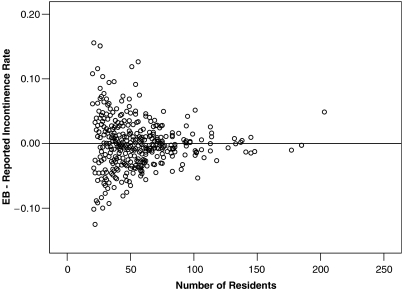
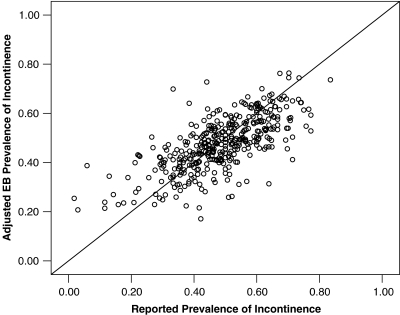
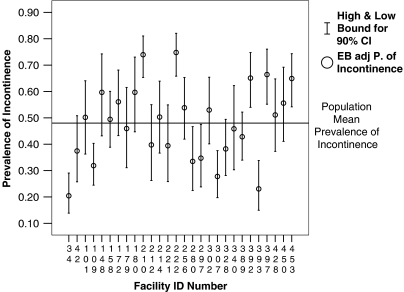
Study design: Prevalence and incidence rates for 12 nursing facility QMs (e.g., use of physical restraints, pressure sores, and weight loss) were estimated with EB methods and risk adjustment using a hierarchical general linear model. Three sets of rates were developed: Nursing Home Compare's current method, unadjusted EB rates, and risk-adjusted EB rates. Bayesian 90 percent credibility intervals (CIs) were constructed around EB rates, and these were used to flag facilities for potential quality of care problems.
Data collection/extraction methods: MDS assessments were performed by nursing facility staff, transmitted electronically to the Minnesota Department of Health, and provided to the investigators.
Principal findings: Facility rates and rankings for the 12 QMs differed substantially using the multilevel models compared with current methods. The EB estimated rates shrank considerably toward the population mean. Risk adjustment had a large impact on some QM rates and a more modest impact on others. When EB CIs were used to flag problem facilities, there was wide variation across QMs in the percentage of facilities flagged.
Conclusions: Multilevel modeling should be applied to Nursing Home Compare and more widely in other health care quality assessment systems.
Figures
References
-
- Arling G, Kane RL, Lewis T, Mueller C. Future Development of Nursing Home Quality Indicators. Gerontologist. 2005;45(2):147–56. - PubMed
-
- Arling G, Karon SL, Sainfort F, Zimmerman DR, Ross R. Risk Adjustment of Nursing Home Quality Indicators. Gerontologist. 1997;37(6):757–66. - PubMed
-
- Ash AS, Shwartz M, Pekoz EA. Comparing Outcomes across Providers. In: Iezzoni LI, editor. Risk Adjustment for Measuring Health Care Outcomes. Ann Arbor, MI: Health Administration Press; 2003. pp. 297–333.
-
- Berlowitz DR, Christiansen CL, Brandeis GH, Ash AS, Kader B, Morris JN, Moskowitz MA. Profiling Nursing Homes Using Bayesian Hierarchical Modeling. Journal of the American Geriatrics Society. 2002;50(6):1126–30. - PubMed
Publication types
MeSH terms
Grants and funding
LinkOut - more resources
Full Text Sources
Medical
Research Materials
Miscellaneous
