Aberrant T-cell ontogeny and defective thymocyte and colonic T-cell chemotactic migration in colitis-prone Galphai2-deficient mice
- PMID: 17490434
- PMCID: PMC2265997
- DOI: 10.1111/j.1365-2567.2007.02629.x
Aberrant T-cell ontogeny and defective thymocyte and colonic T-cell chemotactic migration in colitis-prone Galphai2-deficient mice
Abstract
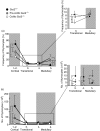
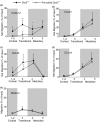
Galphai2-deficient mice, which spontaneously develop colitis, have previously been reported to have an increased frequency of mature, single positive thymocytes compared to wild-type mice. In this study we further characterized the intrathymic changes in these mice before and during overt colitis. Even before the onset of colitis, Galphai2(-/-) thymi weighed less and contained fewer thymocytes, and this was exacerbated with colitis development. Whereas precolitic Galphai2(-/-) mice had unchanged thymocyte density compared to Galphai2(+/-) mice of the same age, this was significantly decreased in mice with colitis. Thymic atrophy in Galphai2(-/-) mice involved mainly the cortex. Using a five-stage phenotypic characterization of thymocyte maturation based on expression of CD4, CD8, TCRalphabeta, CD69 and CD62L, we found that both precolitic and colitic Galphai2(-/-) mice had significantly increased frequencies of mature single-positive CD4(+) and CD8(+) medullary thymocytes, and significantly reduced frequencies and total numbers of immature CD4(+) CD8(+) double-positive thymocytes compared to Galphai2(+/-) mice. Furthermore, cortical and transitional precolitic Galphai2(-/-) thymocytes showed significantly reduced chemotactic migration towards CXCL12, and a trend towards reduced migration to CCL25, compared to wild-type thymocytes, a feature even more pronounced in colitic mice. This impaired chemotactic migration of Galphai2(-/-) thymocytes could not be reversed by increased chemokine concentrations. Galphai2(-/-) thymocytes also showed reduced expression of the CCL25 receptor CCR9, but not CXCR4, the receptor, for CXCL12. Finally, wild-type colonic lamina propria lymphocytes migrated in response to CXCL12, but not CCL25 and, as with thymocytes, the chemokine responsiveness was significantly reduced in Galphai2(-/-) mucosal lymphocytes.
Figures


Similar articles
-
Impaired chemokine-induced migration during T-cell development in the absence of Jak 3.Immunology. 2004 Jun;112(2):191-200. doi: 10.1111/j.1365-2567.2004.01863.x. Immunology. 2004. PMID: 15147562 Free PMC article.
-
Characterization of CCR9 expression and CCL25/thymus-expressed chemokine responsiveness during T cell development: CD3(high)CD69+ thymocytes and gammadeltaTCR+ thymocytes preferentially respond to CCL25.J Immunol. 2002 Jan 1;168(1):134-42. doi: 10.4049/jimmunol.168.1.134. J Immunol. 2002. PMID: 11751956
-
Interplay between T(h)1 and T(h)17 effector T-cell pathways in the pathogenesis of spontaneous colitis and colon cancer in the Gαi2-deficient mouse.Int Immunol. 2013 Jan;25(1):35-44. doi: 10.1093/intimm/dxs089. Epub 2012 Sep 7. Int Immunol. 2013. PMID: 22962436
-
Toward quantifying the thymic dysfunctional state in mouse models of inflammatory bowel disease.Inflamm Bowel Dis. 2013 Mar-Apr;19(4):881-8. doi: 10.1097/MIB.0b013e3182802c58. Inflamm Bowel Dis. 2013. PMID: 23448795 Review.
-
Intrathymic T-cell migration: a combinatorial interplay of extracellular matrix and chemokines?Trends Immunol. 2002 Jun;23(6):305-13. doi: 10.1016/s1471-4906(02)02224-x. Trends Immunol. 2002. PMID: 12072370 Review.
Cited by
-
Maturation and migration of murine CD4 single positive thymocytes and thymic emigrants.Comput Struct Biotechnol J. 2014 Mar 30;9:e201403003. doi: 10.5936/csbj.201403003. eCollection 2014. Comput Struct Biotechnol J. 2014. PMID: 24757506 Free PMC article. Review.
-
A quantitative study of the mechanisms behind thymic atrophy in Gαi2-deficient mice during colitis development.PLoS One. 2012;7(5):e36726. doi: 10.1371/journal.pone.0036726. Epub 2012 May 10. PLoS One. 2012. PMID: 22590596 Free PMC article.
-
CD4+FoxP3+ regulatory T cells from Gαi2-/- mice are functionally active in vitro, but do not prevent colitis.PLoS One. 2011;6(9):e25073. doi: 10.1371/journal.pone.0025073. Epub 2011 Sep 22. PLoS One. 2011. PMID: 21966415 Free PMC article.
-
The Thymus in Chagas Disease: Molecular Interactions Involved in Abnormal T-Cell Migration and Differentiation.Front Immunol. 2020 Sep 2;11:1838. doi: 10.3389/fimmu.2020.01838. eCollection 2020. Front Immunol. 2020. PMID: 32983098 Free PMC article. Review.
-
The Structural and Biochemical Characterization of UNC119B Cargo Binding and Release Mechanisms.Biochemistry. 2021 Jun 15;60(25):1952-63. doi: 10.1021/acs.biochem.1c00251. Online ahead of print. Biochemistry. 2021. PMID: 34130453 Free PMC article.
References
-
- Morrissey PJ, Charrier K, Braddy S, Liggitt D, Watson JD. CD4+ T cells that express high levels of CD45RB induce wasting disease when transferred into congenic severe combined immunodeficient mice. Disease development is prevented by cotransfer of purified CD4+ T cells. J Exp Med. 1993;178:237–44. - PMC - PubMed
-
- Powrie F, Leach MW, Mauze S, Menon S, Caddle LB, Coffman RL. Inhibition of Th1 responses prevents inflammatory bowel disease in scid mice reconstituted with CD45RBhi CD4+ T cells. Immunity. 1994;1:553–62. - PubMed
-
- Hollander GA, Simpson SJ, Mizoguchi E, et al. Severe colitis in mice with aberrant thymic selection. Immunity. 1995;3:27–38. - PubMed
-
- Mombaerts P, Mizoguchi E, Grusby MJ, Glimcher LH, Bhan AK, Tonegawa S. Spontaneous development of inflammatory bowel disease in T cell receptor mutant mice. Cell. 1993;75:274–82. - PubMed
-
- Rudolph U, Finegold MJ, Rich SS, et al. Ulcerative colitis and adenocarcinoma of the colon in G alpha i2-deficient mice. Nat Genet. 1995;10:143–50. - PubMed
Publication types
MeSH terms
Substances
LinkOut - more resources
Full Text Sources
Molecular Biology Databases
Research Materials

