Review
. 2007 Oct 22;4(16):935-48.
doi: 10.1098/rsif.2007.1041.

Spatial dynamics and genetics of infectious diseases on heterogeneous landscapes

Affiliations
Review

Spatial dynamics and genetics of infectious diseases on heterogeneous landscapes

Leslie A Real et al. J R Soc Interface. .

Abstract

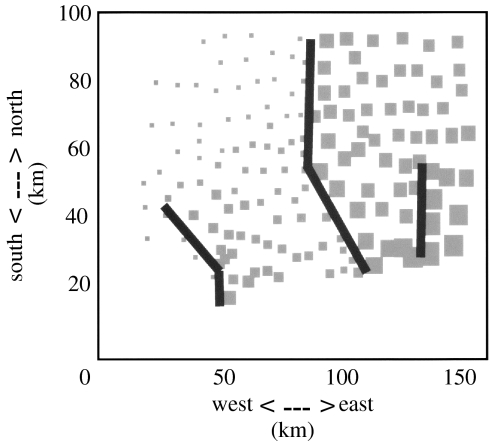
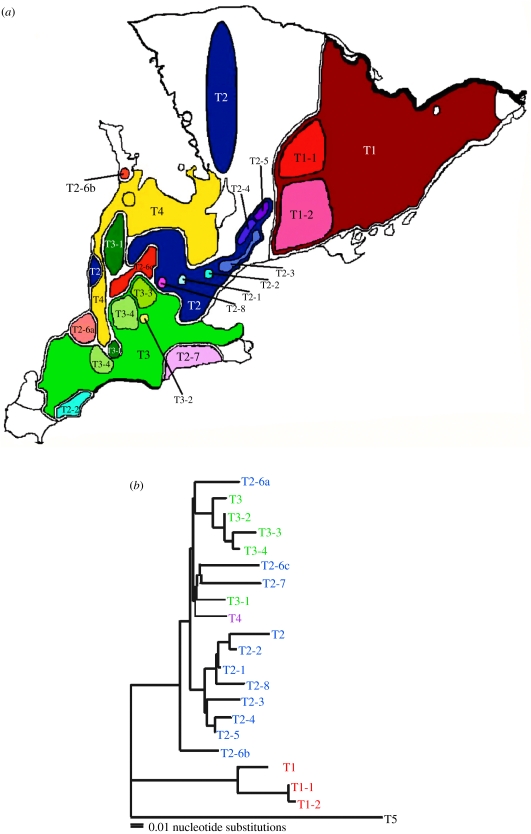
Explicit spatial analysis of infectious disease processes recognizes that host-pathogen interactions occur in specific locations at specific times and that often the nature, direction, intensity and outcome of these interactions depend upon the particular location and identity of both host and pathogen. Spatial context and geographical landscape contribute to the probability of initial disease establishment, direction and velocity of disease spread, the genetic organization of resistance and susceptibility, and the design of appropriate control and management strategies. In this paper, we review the manner in which the physical organization of the landscape has been shown to influence the population dynamics and spatial genetic structure of host-pathogen interactions, and how we might incorporate landscape architecture into spatially explicit population models of the infectious disease process to increase our ability to predict patterns of disease occurrence and optimally design vaccination and control policies.


Figures

Figure 1
Figure 1
The spread of epizootic rabies among raccoons in the Mid-Atlantic region and northeastern United States from a focus (epizootic origin) at the Virginia (VA)/West Virginia (WVA) border illustrated at 5-year intervals from 1980 through 1995. Cells correspond to individual counties within states with violet corresponding to uninfected counties, yellow corresponding to already infected counties and red corresponding to counties that became infected during that year. State abbreviations are ME, Maine; MA, Massachusetts; NY, New York; CT, Connecticut; PA, Pennsylvania; and NC, North Carolina. Data were collected from state public health office assessments of the monthly cases of animal rabies reported annually to the Centers for Disease Control and Prevention.
Figure 2
Figure 2
Schematic of the stochastic spatial simulator and the execution algorithm used to model the spatial dynamics of rabies virus spread. Each geo-political unit (e.g. township, county, city, etc.) is connected locally (λij) and globally (μ). These transmission rates can be variables and determined by habitat and population characteristics (after Smith et al. 2002).
Figure 3
Figure 3
The data and output from the parameterized stochastic spatial simulator developed to predict the spatial spread of raccoon rabies across the state of Connecticut plotting the expected time to first appearance of rabies in raccoons based on stochastic simulation versus the observed time to first appearance of rabies across the 169 townships in Connecticut. Expected time to first appearance was established using the best-fit stochastic simulator and incorporated both heterogeneity in local transmission and long-distance translocation of rabies. Rivers induced a sevenfold reduction in rates of local transmission. Four outlier townships had observed times to first appearance of rabies significantly earlier than that predicted by the model. One township in particular, Putnam, was earlier than all others and is the site of a major trash incinerator for the east coast. Putnam may be experiencing considerable long-distance translocation of animals through the movement of trucks to the incinerator site (Smith et al. 2002).
Figure 4
Figure 4
A schematic map of the differential between time to first appearance across townships in Connecticut when the epidemic was simulated with and without rivers. The size of each grey square corresponds to the difference between the time of first appearance at the country centroid of that location when simulations were run with and without the presence of three rivers. The three black lines correspond to the locations of the three major rivers in Connecticut (i.e. the Housatonic, Connecticut and Thames rivers). Results from the simulations suggest that a sevenfold reduction in local transmission across rivers leads to a 16-month delay in the expected appearance of rabies in the southeast corner of Connecticut. The expected delay is reduced to 11 months when long-distance translocation is added to the simulations (after Smith et al. 2002).
Figure 5
Figure 5
(a) Map of southern Ontario with a superimposed geographical cluster analysis of 20 different G-gene sequence types identified from 83 fox rabies virus variant samples with known geographical coordinates. (b) Maximum likelihood tree based on 1572 bp G-gene nucleotide sequence of fox rabies virus variant over southern Ontario (Real et al. 2005).
Figure 6
Figure 6
Genetic diversity of a feline lentivirus in its Rocky Mountain cougar host and spatial distribution of viral groups. (a) Origin of infected (colours as in b) and uninfected samples (white circles). Area covered by samples in Montana roughly reflects distribution of cougar habitat (forest). (b) Phylogeny of the virus based on concatenated sequence data from two genes. L1 through L8 represent distinct viral lineages with greater than 5% divergence (Biek et al. 2006).
Figure 7
Figure 7
Schematic flow for rabies dynamics over a spatially distributed set of linked n subpopulations where each subpopulation i contains susceptibles (Si), infectious (Ii) and removed (Ri) individuals. Removed individuals correspond to susceptibles that have become immune through the deliver of oral vaccine (Asano et al. in press).
Figure 8
Figure 8
Schematic of the rates of geographical movement aij between subpopulations. (a) Set of movement relations that corresponds to equidistant subpopulations experiencing equal rates of movement. (b) Set of movement relations that corresponds to subpopulations which are variably distant from each other and where movement between subpopulations is inversely proportional to distance between subpopulations. (a) a12=a13=a14; (b) a12>a14>a13.
Figure 9
Figure 9
A schematic of a contact network among susceptible (open circles), infectious (red circles) and recovered/removed (green circles) distributed over three habitat types. Note that the contact rates/probabilities are functions of distance between individuals and habitat type. The wider connections correspond to higher contact rates. Also, contact rates may be influenced by the existence of a ‘contact bridge’ across landscapes, as might occur between habitat A and B.

References

    1. Asano, E., Gross, L. J., Lenhart, S. & Real, A. L. In press. Optimal control of vaccine distribution in a rabies metapopulation model. Math. Biosci. Eng. 1. - PubMed
    1. Avise J.C. Harvard University Press; Cambridge, MA: 2000. Phylogeography: the history and formation of species.
    1. Bermejo M, Rodriguez-Teijeiro J.D, Illera G, Barroso A, Vila C, Walsh P.D. Ebola outbreak killed 5000 gorillas. Science. 2006;314:1564. doi: 10.1126/science.1133105. - DOI - PubMed
    1. Biek R, Drummond A.J, Poss M. A virus reveals population structure and recent demographic history of its carnivore host. Science. 2006;311:538–541. doi: 10.1126/science.1121360. - DOI - PubMed
    1. Biek, R., Henderson, J. C., Waller, L. A., Rupprecht, C. E. & Real, L. A. In press. A high-resolution genetic signature of demographic and spatial expansion in epizootic rabies virus. Proc. Natl Acad. Sci. USA. - PMC - PubMed

Publication types