

The relationship of body mass index to diabetes mellitus, hypertension and dyslipidaemia: comparison of data from two national surveys
- PMID: 17493087
- PMCID: PMC1890993
- DOI: 10.1111/j.1742-1241.2007.01336.x
The relationship of body mass index to diabetes mellitus, hypertension and dyslipidaemia: comparison of data from two national surveys
Erratum in
- Int J Clin Pract. 2007 Oct;61(10):1777-8
Abstract
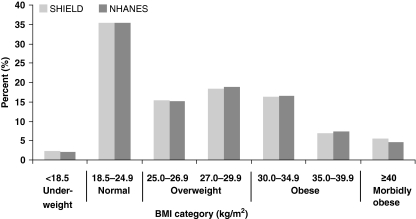
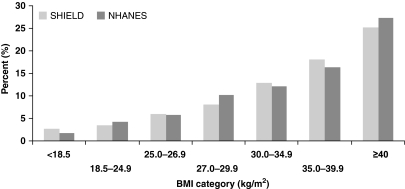
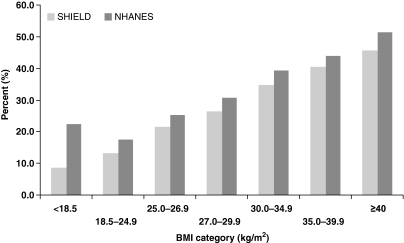
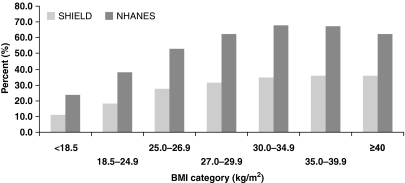
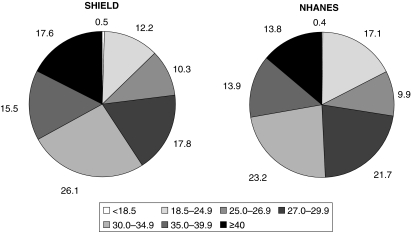
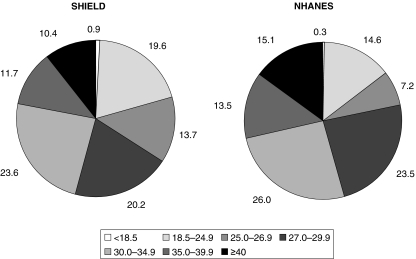
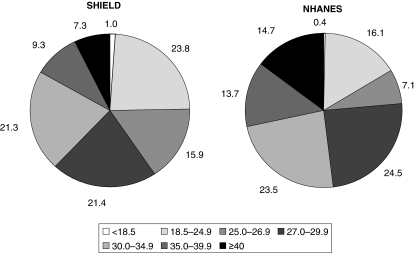
The objectives of this study were to explore the relation between body mass index (BMI) and prevalence of diabetes mellitus, hypertension and dyslipidaemia; examine BMI distributions among patients with these conditions; and compare results from two national surveys. The Study to Help Improve Early evaluation and management of risk factors Leading to Diabetes (SHIELD) 2004 screening questionnaire (mailed survey) and the National Health and Nutrition Examination Surveys (NHANES) 1999-2002 (interview, clinical and laboratory data) were conducted in nationally representative samples>or=18 years old. Responses were received from 127,420 of 200,000 households (64%, representing 211,097 adults) for SHIELD, and 4257 participants for NHANES. Prevalence of diabetes mellitus, hypertension and dyslipidaemia was estimated within BMI categories, as was distribution of BMI levels among individuals with these diseases. Mean BMI was 27.8 kg/m2 for SHIELD and 27.9 kg/m2 for NHANES. Increased BMI was associated with increased prevalence of diabetes mellitus, hypertension and dyslipidaemia in both studies (p<0.001). For each condition, approximately [corrected] 75% or more [corrected] of patients had BMI>or=25 kg/m2. Estimated prevalence of diabetes mellitus and hypertension was similar in both studies, while dyslipidaemia was substantially higher in NHANES than SHIELD. In both studies, prevalence of diabetes mellitus, hypertension and dyslipidaemia occurred across all ranges of BMI, but increased with higher BMI. However, not all overweight or obese patients had these metabolic diseases and not all with these conditions were overweight or obese. Except for dyslipidaemia prevalence, SHIELD was comparable with NHANES. Consumer panel surveys may be an alternative method to collect data on the relationship of BMI and metabolic diseases.
Figures
References
-
- World Health Organization. Obesity and Overweight Facts. [March 2007]. http://www.who.int/hpr/NPH/docs/gs_obesity.pdf.
-
- Hirschfeld RM, et al. Screening for bipolar disorder in the community. J Clin Psychiatry. 2003;64:53–9. - PubMed
-
- Stewart WF. Prevalence of migraine headache in the United States. Relation to age, income, race, and other sociodemographic factors. JAMA. 1992;267:64–9. - PubMed
-
- National Center for Health Statistics. NHANES 1999–2000 Data Files: Data, Docs, Codebooks, SAS Code. [March 2007]. http://www.cdc.gov/nchs/about/major/nhanes/nhanes99_00.htm.
-
- National Center for Health Statistics. NHANES 2001–2002 Data Files: Data, Docs, Codebooks, SAS Code. [March 2007]. http://www.cdc.gov/nchs/about/major/nhanes/nhanes01-02.htm.
Publication types
MeSH terms
LinkOut - more resources
Full Text Sources
Other Literature Sources
Medical
