

Bayesian model-based inference of transcription factor activity
- PMID: 17493251
- PMCID: PMC1892071
- DOI: 10.1186/1471-2105-8-S2-S2
Bayesian model-based inference of transcription factor activity
Abstract
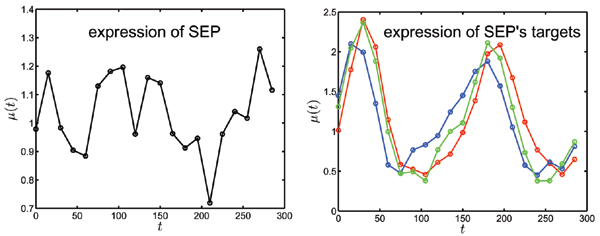
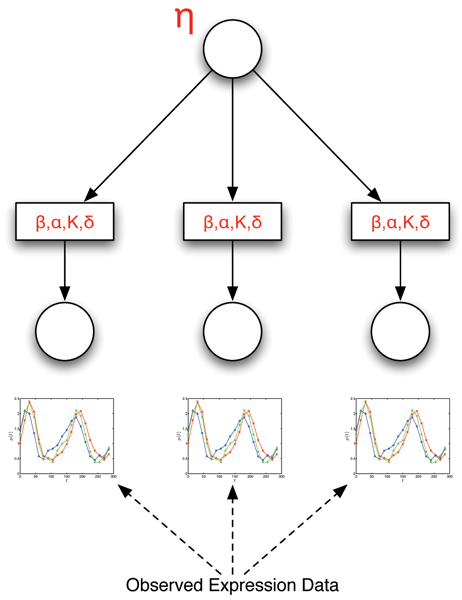
Background: In many approaches to the inference and modeling of regulatory interactions using microarray data, the expression of the gene coding for the transcription factor is considered to be an accurate surrogate for the true activity of the protein it produces. There are many instances where this is inaccurate due to post-translational modifications of the transcription factor protein. Inference of the activity of the transcription factor from the expression of its targets has predominantly involved linear models that do not reflect the nonlinear nature of transcription. We extend a recent approach to inferring the transcription factor activity based on nonlinear Michaelis-Menten kinetics of transcription from maximum likelihood to fully Bayesian inference and give an example of how the model can be further developed.
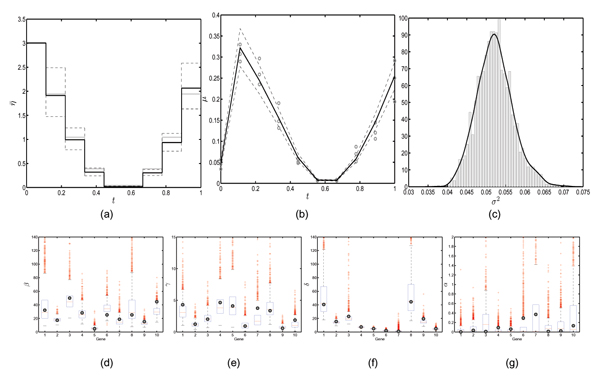
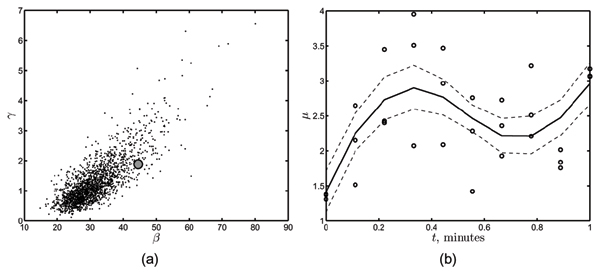
Results: We present results on synthetic and real microarray data. Additionally, we illustrate how gene and replicate specific delays can be incorporated into the model.
Conclusion: We demonstrate that full Bayesian inference is appropriate in this application and has several benefits over the maximum likelihood approach, especially when the volume of data is limited. We also show the benefits of using a non-linear model over a linear model, particularly in the case of repression.
Figures

Similar articles
-
Computational inference of replication and transcription activator regulator activity in herpesvirus from gene expression data.IET Syst Biol. 2008 Nov;2(6):385-96. doi: 10.1049/iet-syb:20070053. IET Syst Biol. 2008. PMID: 19045834
-
Inferring transcriptional regulatory networks from high-throughput data.Bioinformatics. 2007 Nov 15;23(22):3056-64. doi: 10.1093/bioinformatics/btm465. Epub 2007 Sep 22. Bioinformatics. 2007. PMID: 17890736
-
Factor analysis for gene regulatory networks and transcription factor activity profiles.BMC Bioinformatics. 2007 Feb 23;8:61. doi: 10.1186/1471-2105-8-61. BMC Bioinformatics. 2007. PMID: 17319944 Free PMC article.
-
Simulation-based inference of single-molecule experiments.Curr Opin Struct Biol. 2025 Apr;91:102988. doi: 10.1016/j.sbi.2025.102988. Epub 2025 Feb 7. Curr Opin Struct Biol. 2025. PMID: 39921963 Review.
-
Inference of gene regulatory networks using boolean-network inference methods.J Bioinform Comput Biol. 2009 Dec;7(6):1013-29. doi: 10.1142/s0219720009004448. J Bioinform Comput Biol. 2009. PMID: 20014476 Review.
Cited by
-
Quantitative model for inferring dynamic regulation of the tumour suppressor gene p53.BMC Bioinformatics. 2010 Jan 19;11:36. doi: 10.1186/1471-2105-11-36. BMC Bioinformatics. 2010. PMID: 20085646 Free PMC article.
-
A visual data mining tool that facilitates reconstruction of transcription regulatory networks.PLoS One. 2008 Mar 5;3(3):e1717. doi: 10.1371/journal.pone.0001717. PLoS One. 2008. PMID: 18320038 Free PMC article.
-
STARNET 2: a web-based tool for accelerating discovery of gene regulatory networks using microarray co-expression data.BMC Bioinformatics. 2009 Oct 14;10:332. doi: 10.1186/1471-2105-10-332. BMC Bioinformatics. 2009. PMID: 19828039 Free PMC article.
-
Bifurcation analysis informs Bayesian inference in the Hes1 feedback loop.BMC Syst Biol. 2009 Jan 26;3:12. doi: 10.1186/1752-0509-3-12. BMC Syst Biol. 2009. PMID: 19171037 Free PMC article.
-
A continuous optimization approach for inferring parameters in mathematical models of regulatory networks.BMC Bioinformatics. 2014 Jul 29;15(1):256. doi: 10.1186/1471-2105-15-256. BMC Bioinformatics. 2014. PMID: 25070047 Free PMC article.
References
Publication types
MeSH terms
Substances
Grants and funding
LinkOut - more resources
Full Text Sources
Other Literature Sources
