Comparative Study
. 2007 May 10:8:117.
doi: 10.1186/1471-2164-8-117.

Quantitative gene expression assessment identifies appropriate cell line models for individual cervical cancer pathways

Affiliations
Comparative Study

Quantitative gene expression assessment identifies appropriate cell line models for individual cervical cancer pathways

Mark W Carlson et al. BMC Genomics. .

Abstract

Background: Cell lines have been used to study cancer for decades, but truly quantitative assessment of their performance as models is often lacking. We used gene expression profiling to quantitatively assess the gene expression of nine cell line models of cervical cancer.

Results: We find a wide variation in the extent to which different cell culture models mimic late-stage invasive cervical cancer biopsies. The lowest agreement was from monolayer HeLa cells, a common cervical cancer model; the highest agreement was from primary epithelial cells, C4-I, and C4-II cell lines. In addition, HeLa and SiHa cell lines cultured in an organotypic environment increased their correlation to cervical cancer significantly. We also find wide variation in agreement when we considered how well individual biological pathways model cervical cancer. Cell lines with an anti-correlation to cervical cancer were also identified and should be avoided.

Conclusion: Using gene expression profiling and quantitative analysis, we have characterized nine cell lines with respect to how well they serve as models of cervical cancer. Applying this method to individual pathways, we identified the appropriateness of particular cell lines for studying specific pathways in cervical cancer. This study will allow researchers to choose a cell line with the highest correlation to cervical cancer at a pathway level. This method is applicable to other cancers and could be used to identify the appropriate cell line and growth condition to employ when studying other cancers.


Figures

Figure 1
Figure 1
Venn diagram of the overlap of differentially expressed cervical cancer genes in the literature. Eight reports of differentially expressed cervical cancer genes from the literature were compared against each other and to our results. Seven of the studies were combined into one group (203 genes, no overlap between studies). Our results (Carlson, 140 genes) overlapped with Santin (488 genes) by 9 genes and with the rest by 11 genes. Santin had 20 genes in common with the 203 gene combined group. Only 2 genes were found in all three data sets, SLC2A1 and a serine protease inhibitor (clone IDs 25389 and 2562939). Our results show comparable overlap with the literature, and provide additional evidence that the tissue samples analyzed are representative of previous reports on cervical cancer.
Figure 2
Figure 2
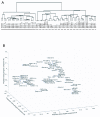
Global transcriptional relationships among tissue samples and cell lines indicate high reproducibility of replicates. A: Hierarchical clustering of samples by their expression profiles. Labels with "a" and "b" represent technical replicates, whereas numbered labels represent biological replicates. The primary separation occurs between cell lines (dashed bar) and cervical tissue (solid bar). All GOG samples and CHTN samples #1, 2, 8, 12 and 13 were invasive cervical cancer biopsies. CHTN samples #6, 10, and 11 were normal cervix. Most replicates clustered together, indicating the data was of high quality. Spots present on the microarray that had a median intensity over background of at least 150 and were present in 80% of the arrays were included in the analysis, resulting in 8,338 genes. B: Singular value decomposition of transcriptional profiles reveals general relationships among the samples, positioned here as the projections among the first 3 singular components (accounting for 40% of the variance, [see Additional file 6]. Again, cell lines were separated from cervical tissue.
Figure 3
Figure 3
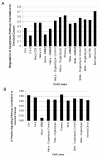
Gene expression correlations quantitatively identify better cell line models of cervical tissue. Gene expression correlations were calculated for all cell lines and growth conditions against both normal cervix and cervical cancer. Cell lines were cultured in ATCC recommended media as monolayers. SiHa and HeLa cell lines were also cultured in different media as well as in an organotypic environment. In addition to the organotypic culture, a control was used that left out the fibroblasts, which prevented the epithelial cell line to stack in 3-dimensions. The primary, C4-I, and C4-II cell lines had the highest correlation to cervical cancer and therefore were the better general models of cervical cancer out of the cell lines we tested. Changing the media from MEM to DMEM increased the correlation to cervical cancer for the HeLa and SiHa cell lines, as well as culturing them in an organotypic environment. Error bars were derived from the standard deviation of the correlation of a cell line against each individual patient biopsy.
Figure 4
Figure 4
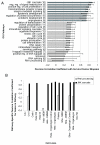
Variation in the modeling performance of cell lines to cervical cancer at a pathway-specific level. A: The "Regulation of Apoptosis" pathway (GO:42981) revealed that better global model to cervical cancer (primary, C4-I, and C4-II, discussed above) were not necessarily better models of specific pathways. In this pathway, the best models among those we tested were the primary cell line and HeLa cultured in an organotypic environment. Eight genes from the sub-pathway "Anti-Apoptosis" (GO:6916) were primarily responsible for lowering the correlation of the C4-II cell line. An average of 71 ± 5 genes were used to calculate the correlation for each cell line. B: In the example of the "G-protein Signaling" pathway (GO:7186), HeLa cultured as a monolayer in ATCC recommended media had an anti-correlation (-0.3) to cervical cancer. Fourteen out of 71 genes were primarily responsible for the negative correlation to cervical cancer. An average of 72 ± 7 genes were used to calculate the correlation for each cell line.
Figure 5
Figure 5
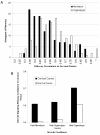
Highest and lowest correlations of modeled GO pathways between cell lines and cancer, as well as normal cervix and cervical cancer. A: The pathways where almost any cell line is an adequate model of either normal cervix or cervical cancer are shaded grey, while the pathways where only one or two cell lines are adequate models are white. The pathway example "RNA Processing" indicates some cell lines were anti-correlated and therefore a quantitative analysis was needed to identify better models that could be used to study this pathway. Error bars were generated from the correlation of a single cell line for each pathway and calculating the standard deviation. The pathways shown here represented a minimum of four cell lines or growth conditions. Numbers in parenthesis indicate how many cell lines were used to calculate the correlation. B: The highest and lowest pathway correlations between normal cervix and cervical cancer. The JNK cascade has a high correlation between normal and tumor, and is modeled well by most cell lines (Figure 5A). Mitosis and a number of other pathways involved in growth and regulation show poor correlation in their gene expression between normal and tumor, as expected. Numbers in parenthesis indicate how many genes were used to calculate the Pearson correlation coefficient.
Figure 6
Figure 6
Simple media changes to culture conditions increase the HeLa cell line's correlation to cervical cancer. Three pathways provided examples of how the correlation to normal cervix increased when HeLa cells were cultured in rich DMEM media versus ATCC recommended MEM media as monolayers. DMEM media contained glucose, and the expression of PDK4 indicated HeLa cells cultured in DMEM experience a nutrient-rich environment, similar to in vivo conditions.
Figure 7
Figure 7
HeLa organotypic cultures are better models of cervical cancer than HeLa monolayer cultures. A: Histogram of the number of pathways at each specific correlation for HeLa cells cultured as monolayer (black) and in an organotypic environment (white). There were more pathways with a higher correlation to cervical cancer in the organotypic culture than in monolayer (p < 0.004, t-test). Therefore, organotypic cultures were better models of cervical cancer than simple monolayer cultures. B: In the ''Cell-Cell Signaling'' pathway (GO:7267), HeLa cells cultured in an organotypic culture had a higher correlation to both normal cervix and cervical cancer than either monolayer or organotypic control cultures.

Similar articles

Cited by

References

    1. Goodwin EC, DiMaio D. Repression of human papillomavirus oncogenes in HeLa cervical carcinoma cells causes the orderly reactivation of dormant tumor suppressor pathways. Proceedings of the National Academy of Sciences of the United States of America. 2000;97:12513–12518. doi: 10.1073/pnas.97.23.12513. - DOI - PMC - PubMed
    1. Harima Y, Togashi A, Horikoshi K, Imamura M, Sougawa M, Sawada S, Tsunoda T, Nakamura Y, Katagiri T. Prediction of outcome of advanced cervical cancer to thermoradiotherapy according to expression profiles of 35 genes selected by cDNA microarray analysis. Int J Radiat Oncol Biol Phys. 2004;60:237–248. doi: 10.1016/j.ijrobp.2004.02.047. - DOI - PubMed
    1. Liotta L, Petricoin E. Molecular profiling of human cancer. Nature Reviews Genetics. 2000;1:48–56. doi: 10.1038/35049567. - DOI - PubMed
    1. Burdall SE, Hanby AM, Lansdown MR, Speirs V. Breast cancer cell lines: friend or foe? Breast Cancer Research. 2003;5:89–95. doi: 10.1186/bcr577. - DOI - PMC - PubMed
    1. Ahn WS, Huh SW, Bae SM, Lee IP, Lee JM, Namkoong SE, Kim CK, Sin JI. A major constituent of green tea, EGCG, inhibits the growth of a human cervical cancer cell line, CaSki cells, through apoptosis, G(1) arrest, and regulation of gene expression. DNA & Cell Biology. 2003;22:217–224. doi: 10.1089/104454903321655846. - DOI - PubMed

Publication types

MeSH terms