

Forty mouse strain survey of voluntary calcium intake, blood calcium, and bone mineral content
- PMID: 17493644
- PMCID: PMC2085359
- DOI: 10.1016/j.physbeh.2007.03.027
Forty mouse strain survey of voluntary calcium intake, blood calcium, and bone mineral content
Abstract
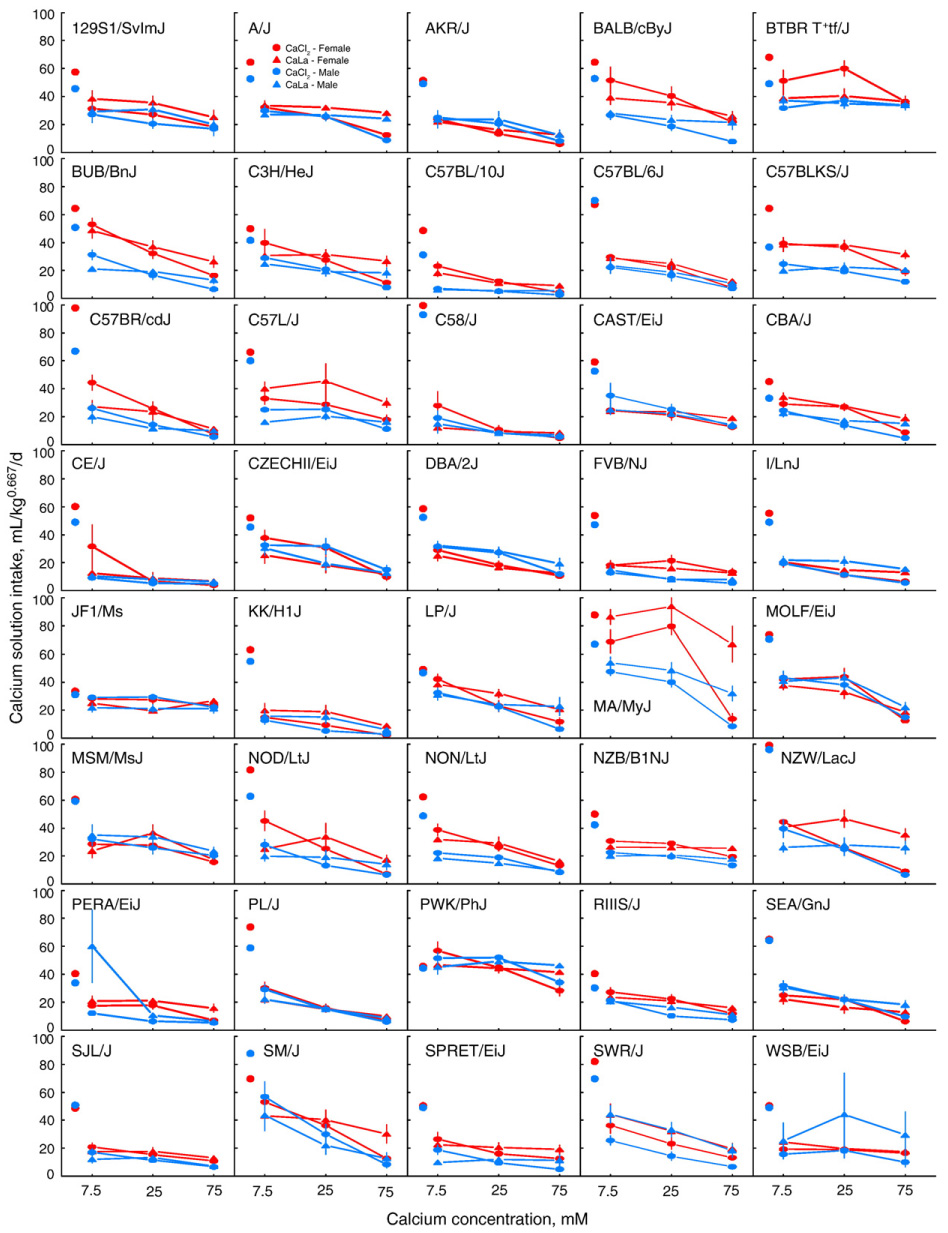
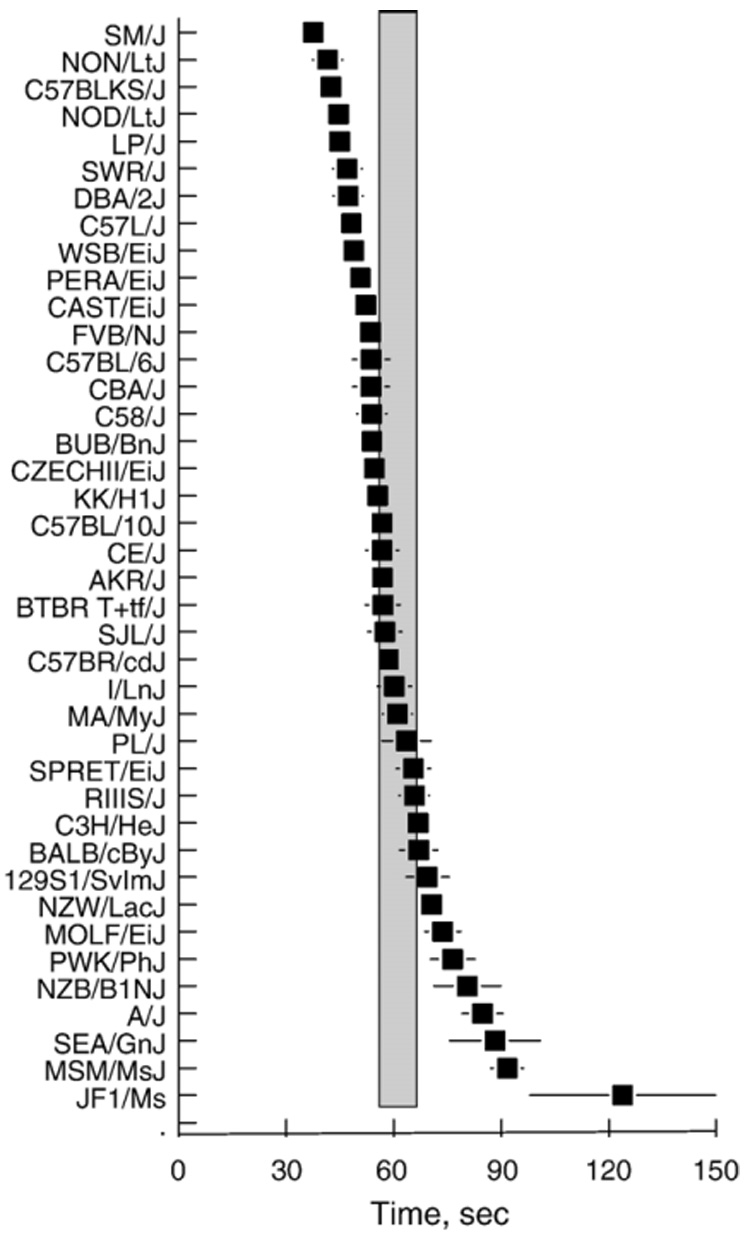
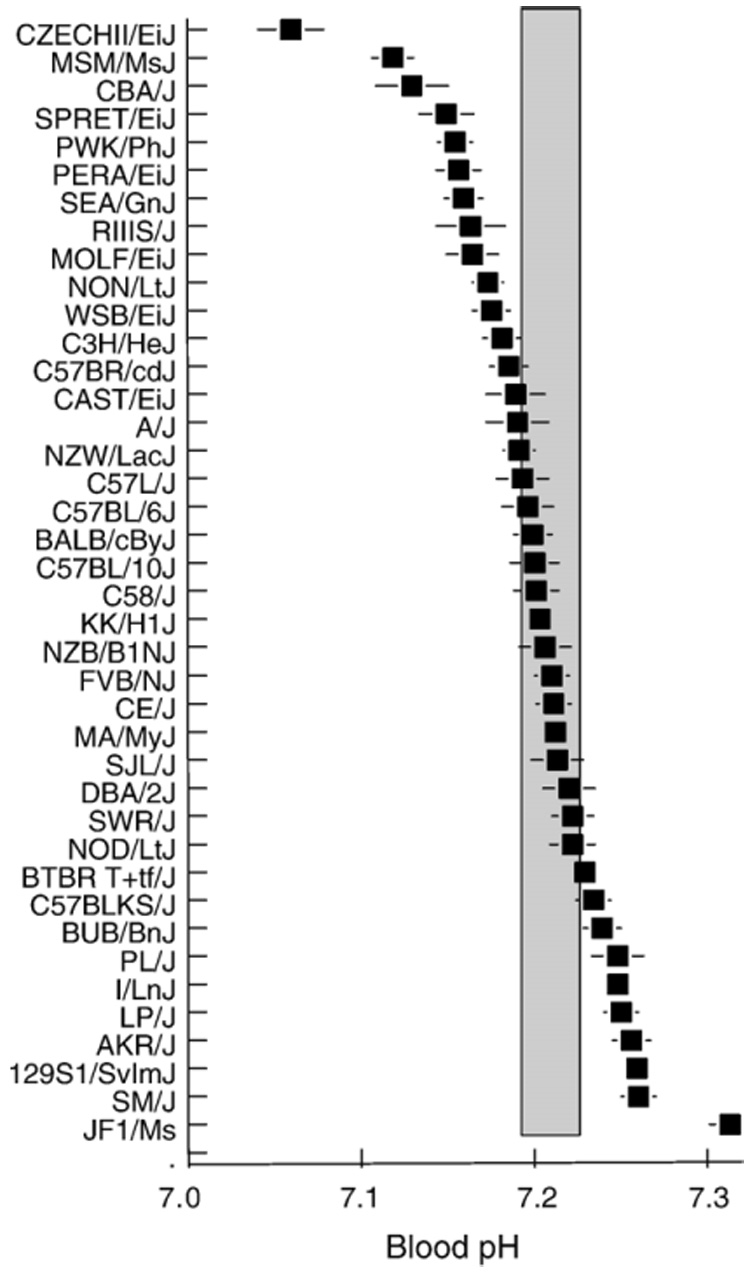
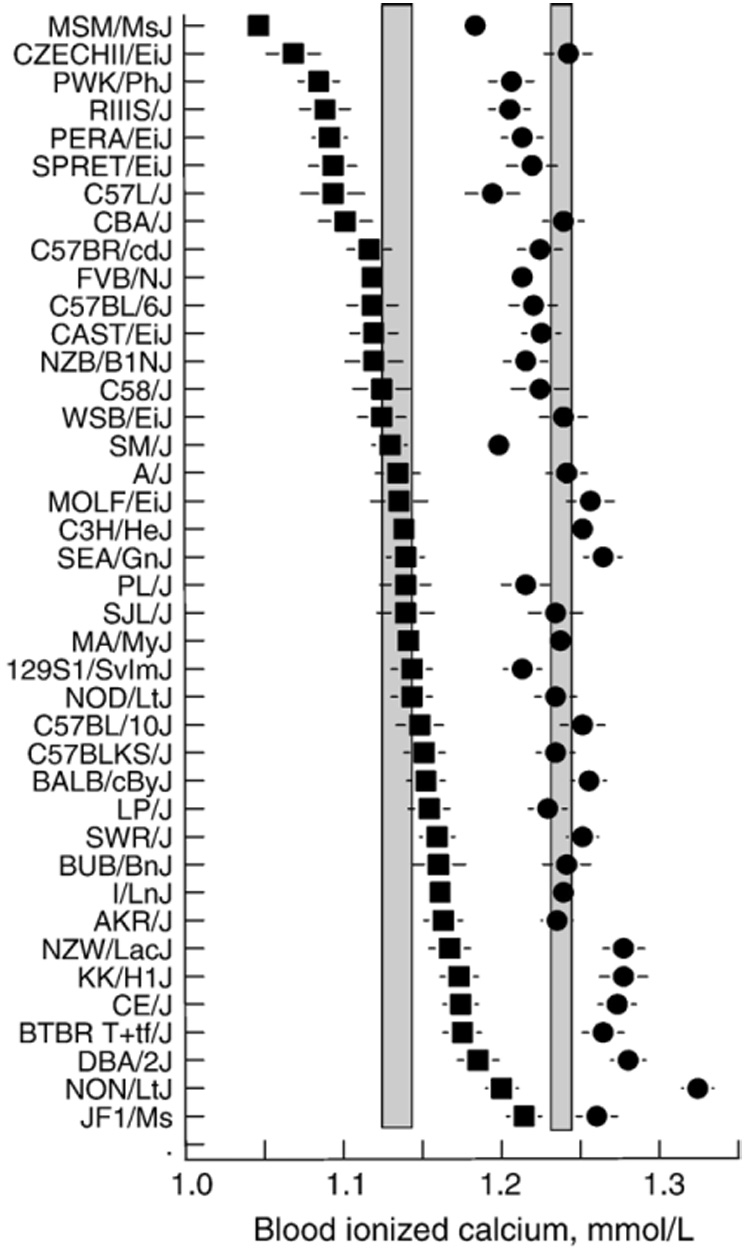
We measured voluntary calcium intake, blood calcium, and bone mineral content of male and female mice from 40 inbred strains. Calcium intakes were assessed using 48-h two-bottle tests with a choice between water and one of the following: water, 7.5, 25, and 75 mM CaCl(2), then 7.5, 25, and 75 mM calcium lactate (CaLa). Intakes were affected by strain, sex, anion, and concentration. In 11 strains females consumed more calcium than did males and in the remaining 29 strains there were no sex differences. Nine strains drank more CaLa than CaCl(2) whereas only one strain (JF1/Ms) drank more CaCl(2) than CaLa. Some strains had consistently high calcium intakes and preferred all calcium solutions relative to water (e.g., PWK/PhJ, BTBR T(+)tf/J, JF1/Ms). Others had consistently low calcium intakes and avoided all calcium solutions relative to water (e.g., KK/H1J, C57BL/10J, CE/J, C58/J). After behavioral tests, blood was sampled and assayed for pH, ionized calcium concentration, and plasma total calcium concentration. Bone mineral density and content were assessed by DEXA. There were no significant correlations between any of these physiological measures and calcium intake. However, strains of mice that had the highest calcium intakes generally fell at the extremes of the physiological distributions. We conclude that the avidity for calcium is determined by different genetic architecture and thus different physiological mechanisms in different strains.
Figures


Similar articles
-
Forty mouse strain survey of water and sodium intake.Physiol Behav. 2007 Aug 15;91(5):620-31. doi: 10.1016/j.physbeh.2007.03.025. Epub 2007 Apr 1. Physiol Behav. 2007. PMID: 17490693 Free PMC article.
-
Calcium taste preferences: genetic analysis and genome screen of C57BL/6J x PWK/PhJ hybrid mice.Genes Brain Behav. 2008 Aug;7(6):618-28. doi: 10.1111/j.1601-183X.2008.00398.x. Epub 2008 Mar 19. Genes Brain Behav. 2008. PMID: 18363849 Free PMC article.
-
Genetic variance contributes to ingestive processes: a survey of eleven inbred mouse strains for fat (Intralipid) intake.Physiol Behav. 2007 Jan 30;90(1):82-94. doi: 10.1016/j.physbeh.2006.08.028. Epub 2006 Oct 9. Physiol Behav. 2007. PMID: 17028044
-
Gene discovery and the genetic basis of calcium consumption.Physiol Behav. 2008 Aug 6;94(5):649-59. doi: 10.1016/j.physbeh.2008.04.004. Epub 2008 Apr 13. Physiol Behav. 2008. PMID: 18499198 Free PMC article. Review.
-
Calcium requirements during adolescence to maximize bone health.J Am Coll Nutr. 2001 Apr;20(2 Suppl):186S-191S. doi: 10.1080/07315724.2001.10719030. J Am Coll Nutr. 2001. PMID: 11349941 Review.
Cited by
-
Influence of cross-fostering on preference for calcium chloride in C57BL/6J and PWK/PhJ mice.Physiol Behav. 2013 Oct 2;122:159-62. doi: 10.1016/j.physbeh.2013.09.002. Epub 2013 Sep 13. Physiol Behav. 2013. PMID: 24041724 Free PMC article.
-
Influence of estrous and circadian cycles on calcium intake of the rat.Physiol Behav. 2013 Mar 15;112-113:56-60. doi: 10.1016/j.physbeh.2013.02.011. Epub 2013 Feb 28. Physiol Behav. 2013. PMID: 23458631 Free PMC article.
-
Quantitative trait loci identified for blood chemistry components of an advanced intercross line of chickens under heat stress.BMC Genomics. 2016 Apr 14;17:287. doi: 10.1186/s12864-016-2601-x. BMC Genomics. 2016. PMID: 27076351 Free PMC article.
-
Preparing Excitable Cardiac Papillary Muscle and Cardiac Slices for Functional Analyses.Front Physiol. 2022 Mar 3;13:817205. doi: 10.3389/fphys.2022.817205. eCollection 2022. Front Physiol. 2022. PMID: 35309048 Free PMC article.
-
Taste dysfunction in BTBR mice due to a mutation of Itpr3, the inositol triphosphate receptor 3 gene.Physiol Genomics. 2013 Sep 16;45(18):834-55. doi: 10.1152/physiolgenomics.00092.2013. Epub 2013 Jul 16. Physiol Genomics. 2013. PMID: 23859941 Free PMC article.
References
-
- Barrett CP, Donati EJ, Volz JE, Smith EB. Variations in serum calcium between strains of inbred mice. Lab Anim Sci. 1975;25:638–640. - PubMed
Publication types
MeSH terms
Substances
Grants and funding
LinkOut - more resources
Full Text Sources
Medical
Molecular Biology Databases
Miscellaneous
