Comparative Study
. 2007 Aug 15;91(5):593-600.
doi: 10.1016/j.physbeh.2007.03.026. Epub 2007 Apr 1.

Forty mouse strain survey of body composition

Affiliations
Comparative Study

Forty mouse strain survey of body composition

Danielle R Reed et al. Physiol Behav. .

Abstract

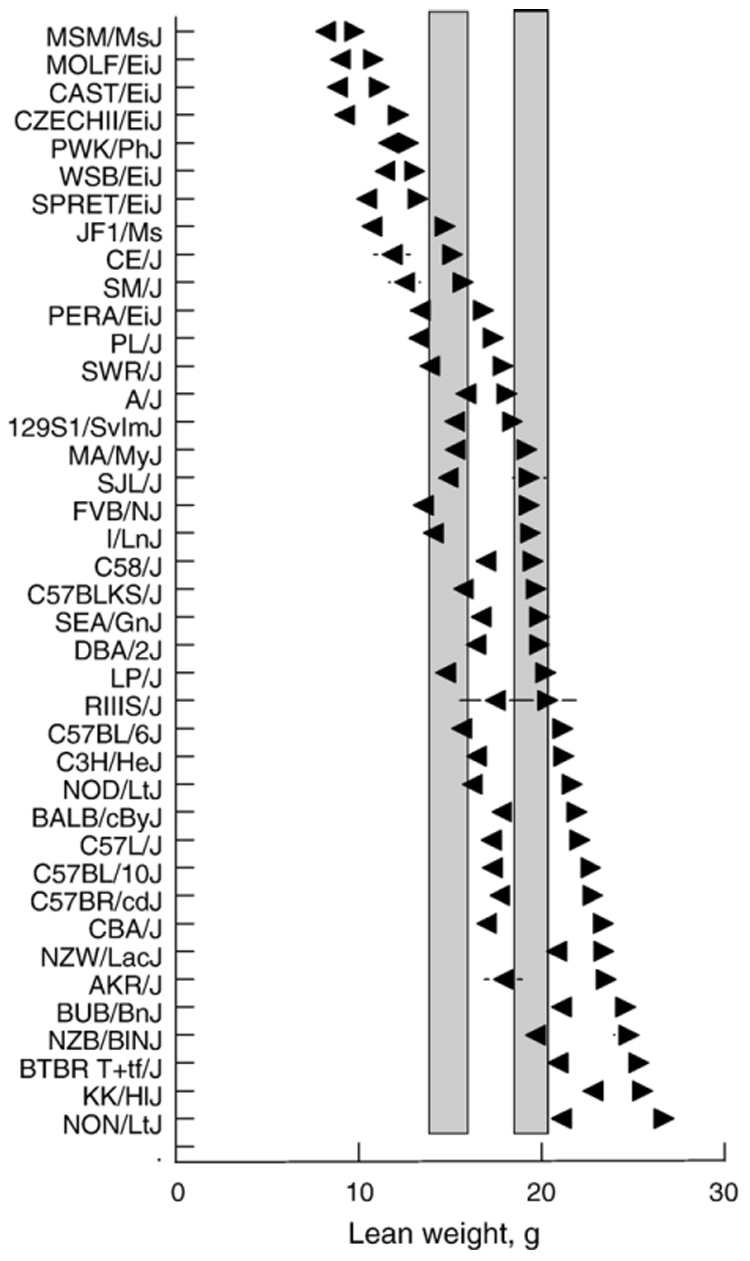
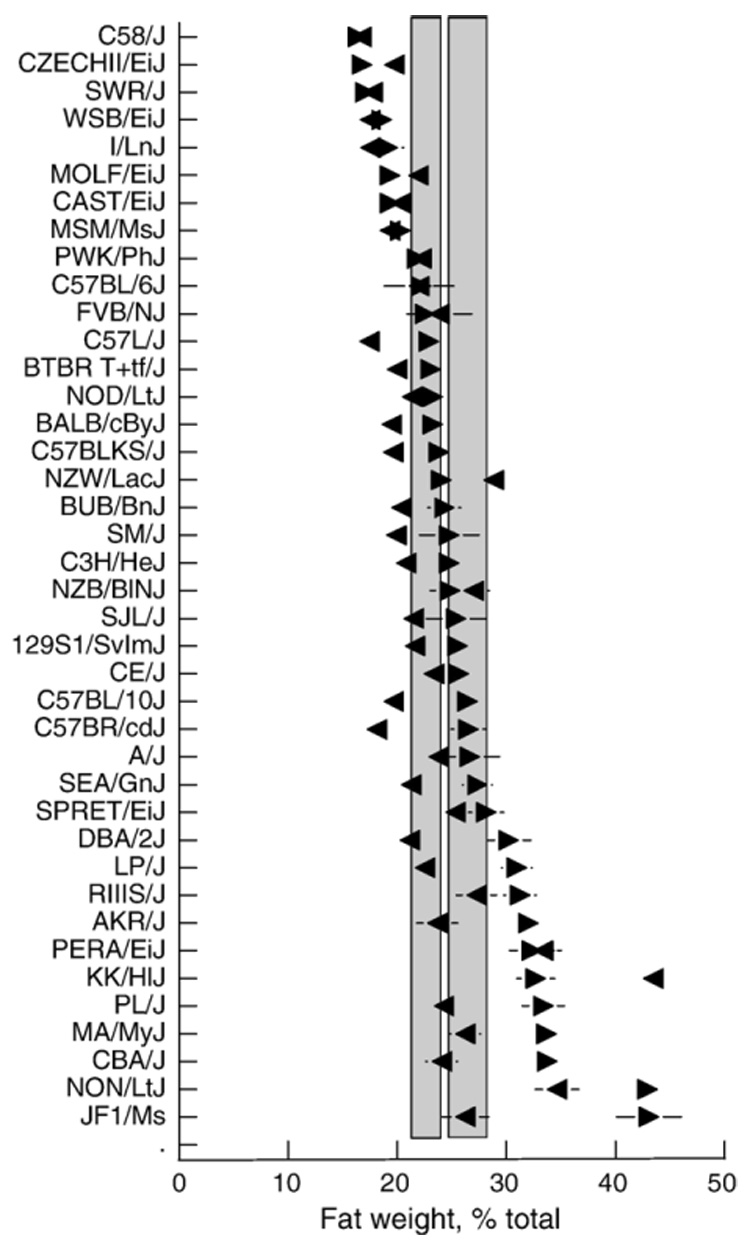
We measured body weight and composition of approximately 10 male and approximately 10 female mice from 40 inbred strains. Body composition was assessed in approximately 16-wk old mice that had been individually housed and fed a high-carbohydrate, low-fat diet (AIN-76A) for the previous 8 wk. Carcass lean and fat weights were assessed using a PIXIMus II DEXA and confirmed by fat extraction assay. There was a nearly continuous range of body weights, from a strain mean+/-SE of 11.4+/-0.2 g (MSM/MsJ) to 39.3+/-1.8 g (NON/LtJ). The percentage of body weight that was fat (%Fat) ranged from 16+/-4% (C58/J) to 39+/-2% (NON/LtJ). In general, heavier strains had a higher %Fat (r=0.57) but several light strains were also quite fat (e.g., SPRET/EiJ, body weight=15.7+/-0.6 g, %Fat=26+/-1%). Males were significantly heavier than females in 26 strains and significantly fatter than females in 9 strains; only the KK/H1J strain had fatter females than males. Some of the fattest strains are infrequently used in obesity experiments, for example the JF1/Ms and CBA/J strains. These data illustrate the diversity of body weight and composition in inbred mice. They will serve as a reference standard and assist in the selection of strains for future work.


Figures

Fig. 1.
Fig. 1.
Mean±SEM carcass body weight (BWt) of male (▶) and female (◀) mice from 40 strains, age ~16 wk. Strains are arranged in order from lowest to highest average body weight of males. Vertical shaded bars are 95% confidence intervals from the overall mean for females (left bar) and males (right bar). Horizontal lines are standard errors of the mean; these are smaller than the symbols in most cases.
Fig. 2.
Fig. 2.
Mean±SEM weight of lean tissue (LeanWt) from carcasses of male (▶) and female (◀) mice from 40 strains, age ~16 wk. Strains are arranged in order from lowest to highest lean weight of males. Vertical shaded bars are 95% confidence intervals from the overall mean for females (left bar) and males (right bar). Horizontal lines are standard errors of the mean; these are smaller than the symbols in most cases.
Fig. 3.
Fig. 3.
Mean±SEM weight of adipose tissue (FatWt) from carcasses of male (▶) and female (◀) mice from 40 strains, age ~16 wk. Strains are arranged in order from lowest to highest fat weight of males. Vertical shaded bars are 95% confidence intervals from the overall mean for females (left bar) and males (right bar). Horizontal lines are standard errors of the mean; these are smaller than the symbols in most cases.
Fig. 4.
Fig. 4.
Mean±SEM proportion of carcass weight that is fat (%Fat) of male (▶) and female (◀) mice from 40 strains, age ~16 wk. Strains are arranged in order from lowest to highest average percent fat weight of males. Vertical shaded bars are 95% confidence intervals from the overall mean for females (left bar) and males (right bar). Horizontal lines are standard errors of the mean; these are smaller than the symbols in most cases.
Fig. 5.
Fig. 5.
Scatter plots and Pearson correlation coefficients of 40 strain mean values for males (in blue) and females (in pink) for each combination of four measures of body composition. Fat, %=body fat content as a proportion of carcass weight. All correlations were highly significant (p<0.001) except those between lean weight and fat, %.

References

    1. Bachmanov AA, Reed DR, Beauchamp GK, Tordoff MG. Food intake, water intake, and drinking spout side preference of 28 mouse strains. Behav Genet. 2002;32:435–443. - PMC - PubMed
    1. Belknap JK. Effect of within-strain sample size on QTL detection and mapping using recombinant inbred mouse strains. Behav Genet. 1998;28:29–38. - PubMed
    1. Bunger L, Laidlaw A, Bulfield G, Eisen EJ, Medrano JF, Bradford GE, et al. Inbred lines of mice derived from long-term growth selected lines: unique resources for mapping growth genes. Mamm Genome. 2001;12:678–686. - PubMed
    1. Castle WE. Size inheritance. Am Nat. 1941;75:488–498.
    1. Chesler EJ, Mogil JS, Williams RW. SNP haplotype mapping with inbred strains. 2002. http:// www.nervenet.org/xlfiles/SNP/CheslerSNPMapper.xls.

Publication types