. 2007 Jun 5;17(11):911-21.
doi: 10.1016/j.cub.2007.04.040. Epub 2007 May 10.

Genetic modulation of BDNF signaling affects the outcome of axonal competition in vivo

Affiliations

Genetic modulation of BDNF signaling affects the outcome of axonal competition in vivo

Luxiang Cao et al. Curr Biol. .

Abstract

Background: Activity-dependent competition that operates on branch stability or formation plays a critical role in shaping the pattern and complexity of axonal terminal arbors. In the mammalian central nervous system (CNS), the effect of activity-dependent competition on axon arborization and on the assembly of sensory maps is well established. However, the molecular pathways that modulate axonal-branch stability or formation in competitive environments remain unknown.

Results: We establish an in vivo axonal-competition paradigm in the mouse olfactory system by employing a genetic strategy that permits suppression of neurosecretory activity in random subsets of olfactory sensory neurons (OSNs). Long-term follow up confirmed that this genetic manipulation triggers competition by revealing a bias toward selective stabilization of active arbors and local degeneration of synaptically silent ones. By using a battery of genetically modified mouse models, we demonstrate that a decrease either in the total levels or the levels of activity-dependent secreted BDNF (due to a val66met substitution), rescues silent arbors from withering. We show that this effect may be mediated, at least in part, by p75(NTR).

Conclusions: We establish and experimentally validate a genetic in vivo axonal-competition paradigm in the mammalian CNS. By using this paradigm, we provide evidence for a specific effect of BDNF signaling on terminal-arbor pruning under competition in vivo. Our results have implications for the formation and refinement of the olfactory and other sensory maps, as well as for neuropsychiatric diseases and traits modulated by the BDNF val66met variant.


Figures
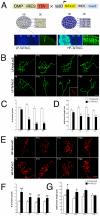
Figure 1
Figure 1. Terminal arbor complexity in LF-and HF-TeTxLC lines
(A) A genetic strategy to trigger competition. Schematic illustration of the induced expression of tetanus toxin light chain (TeTxLC) in olfactory sensory neurons. Compound heterozygotes containing OMP-IRES-tTA and tetO-TeTxLC-IRES-tau-lacZ alleles will express tetanus toxin and tauLacZ in the absence of doxycycline and trigger competition in the LF-TeTxLC but not in the HF-TeTxLC lines. Representative low magnification images from the olfactory bulb and olfactory epithelium of LF-TeTxLC and HF-TeTxLC lines are shown in the bottom. (B) Sample images depicting postnatal development (P6 - P30) of OSN axon terminal arbors in transgenic mice expressing TeTxLC together with tauLacZ at a low frequency (LF-TeTxLC, bottom panels), or in control mice expressing tauLacZ only, at a low frequency (LF-tauLacZ, top panels). In each panel, one axon arbor labeled with an anti-β-gal antibody is shown in green. We used confocal microscopy-mediated reconstruction of the terminal arbors of individual OSN axons in preparations from postnatal days 0, 4, 6, 10, 14 and 30. Identical patterns of terminal arbor pruning were observed in three independently founded LF-TeTxLC lines (data not shown). Insert in the P14 / LF-TeTxLC image depicts a wild-type DiI-labeled (red) active axon arbor, representative of the majority of axons arbors in the LF-TeTxLC line at P14. Because the probability of observing adjacent β-gal or DiI positive axons is prohibitively low, we have not been able to determine whether withdrawal of the synaptically silent arbors is accompanied by expansion of their active neighbors. Scale bar, 20 μm. (C, D) Evaluation of terminal arbor complexity in OSN axons from LF-TeTxLC mice (n = 5), or control LF-tauLacZ mice (n = 5). Axonal arbors were analyzed for number of branch points per arbor (C) and total branch length per arbor (D). A minimum of 10 axonal arbors from each animal were scanned, reconstructed and quantitatively analyzed. (E) Images depicting postnatal development (P6 - P30) of OSN axon terminal arbors in transgenic mice expressing TeTxLC together with tauLacZ at a high frequency in more than 70 - 80% of OSNs (HF-TeTxLC) (bottom panels), or in control mice expressing tauLacZ only at a high frequency (HF-tauLacZ) (top panels). In each panel, one arbor labeled with the lipophilic tracer DiI is shown in red. Scale bar, 20 μm. (F, G) Evaluation of terminal arbor complexity in OSN axons from HF-TeTxLC mice (n = 5), or control HF-tauLacZ mice (n = 5). At least 10 terminal arbors per animal were analyzed for number of branch points per arbor (F) and total branch length per arbor (G). Results are presented as mean ± S.M.E. Single asterisk indicate P < 0.05 and double asterisks indicate P < 0.01. Sample images were selected as representative of the changes of arbor complexity.
Figure 2
Figure 2. NMDA receptor activity plays a permissive role in competition among terminal arbors
(A) Sample images depicting the fate of OSN axon terminal arbors in LF-TeTxLC (top panel), control tauLacZ (middle panel) and HF-TeTxLC (bottom panel) transgenic mice following systemic administration of MK-801, or saline, during P6 - P10. Two time-points after the last injection were examined, as indicated. Note that following the termination of MK-801 administration, individual axonal arbors in MK-801-treated mice fail to reveal the dramatic decrease in complexity observed in saline-treated or untreated LF-TeTxLC mice. By contrast, four weeks after cessation of MK-801 administration and clearance of the drug, simple degenerating terminals re-appear. Scale bar, 20 μm. (B, C) Analysis of ORN axon terminal arbor complexity of tauLacZ control mice (n = 6), LF-TeTxLC (n = 5) mice and HF-TeTxLC (n = 5) that received MK-801 injections during P6 - P10 and were examined 4 days or 4 weeks post-injection. B: number of branch points; C: total branch length. Single asterisk indicates P < 0.05 and double asterisks indicate P < 0.01.
Figure 3
Figure 3. Competition results in local degeneration of inactive branches
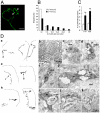
(A) Image of an OSN axon terminal arbor from LF-TeTxLC transgenic mice, carrying large axonal varicosities (LAVs, indicated by white arrowheads) with an oval or spherical shape. Scale bar: 20 μm (B) Frequency distribution of terminal arbor LAVs in LF-TeTxLC mice (n = 78 arbors) and control LF-tauLacZ mice (n = 60 arbors). Note the striking difference between the two distributions. (C) Density (number per 100 μm) of LAVs in OSN axon terminal arbors of LF-TeTxLC mice and control LF-tauLacZ mice. Double asterisks indicate P < 0.01. (D) Ultrastructural analysis of terminals on arbors from LF-tauLacZ (a-d) and LF-TeTxLC (e-k). Camera Lucida drawings made from 100 μm (e both panels and h left panel), or 10 μm (a and h right panel) plastic-embedded sections of olfactory sensory arbors within glomeruli (dashed lines indicate borders). Shown in (b) is a representative axon arbor within a glomerulus as visualized with anti-β-gal antibody using phase microscopy on a 100 μm thick section. In both genotypes, labeled round varicosities (c in drawing in a; f in drawing in e) make typical olfactory sensory axon contacts within glomeruli (c, f) whereas the LAVs (d in drawing in a; g in drawing in e; i in drawing in h) display cytological signs of degeneration (d, g, i-k). In c, d, and f arrowheads indicate synapses; arrows point to multivesicular bodies (mv) and engulfed structures; ax: β-gal positive axon terminals; den: dendrites.
Figure 4
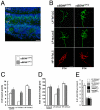
Figure 4. BDNF levels influence competition-driven terminal axon arborization
(A) BDNF immunoreactivity (green signal) in OB. BDNF immunoreactivity was detected in the soma of mitral cell and periglomerular cell, as well as within glomeruli, but not in olfactory epithelium (not shown). MCL: mitral cell layer; EPL: external plexiform layer; GL: glomerular layer. Scale bar, 50 μm. (B) Sample images depicting the fate of OSN axon terminal arbors in LF-TeTxLC (top panel), control LF-tauLacZ (middle), or HF-TeTxLC (bottom) transgenic mice with normal (BDNF (+/+)), or half normal (BDNF (+/-)) BDNF levels at P14. Note that sample images were selected as representative of the changes of arbor complexity, not the number of LAVs. Scale bar, 20 μm. (C, D) Quantitation of OSN terminal arbor complexity in tauLacZ control mice, LF-TeTxLC or HF-TeTxLC mice, in either BDNF (+/+) or BDNF (+/-) mice (n = 6 mice per genotype) at P14. C: number of branch points; D: total branch length. (E) Analysis of LAV density in OSN terminal arbor in BDNF (+/+), or BDNF (+/-) ; LF-TeTxLC mice, as well as in wild-type tauLacZ control mice. Single asterisk indicates P < 0.05 and double asterisks indicate P < 0.01.
Figure 5
Figure 5. BDNFmet variant influences the competition-driven terminal axon arborization
(A) Mouse genomic DNA (indicated in red) spanning the mouse BDNF gene and including flanking sequence 11 kb upstream and 3 kb downstream was cloned into the self-excisable pACN/neo cassette. The BDNFmet and BDNFval targeting constructs were generated by replacing the mouse coding sequence with the corresponding 274 bp long homologous human sequence (shown in blue) carrying either the val or the met allele. Because the mouse and human protein differ in 11 aminoacid residues all located within the swapped 274 bp region, this genetic manipulation essentially “humanizes” the entire coding region of the mouse BDNF gene, thus resulting in two transgenic mouse strains in which human BDNFmet or BDNFval gene transcription is regulated by endogenous mouse BDNF regulatory elements. Homologous recombination in targeted embryonic stem cell clones, was confirmed by Southern blotting and hybridization, using a diagnostic Mfe1 restriction digest and a probe whose location is marked by an orange box. Predicted fragments (5.9 kb or 3.8 kb) are indicated and results of the Southern blot analysis are shown at the bottom panel (left). A diagnostic restriction enzyme analysis using Pml1 on DNA from tail biopsy samples from BDNF(met/+) and BDNF(val/+) heterozygous knock-in mice is also shown in the bottom panel (middle). Total levels of BDNF from OB extracts prepared from BDNF(met/met) and BDNF(val/val) and littermate BDNF (+/+) control mice, as well as a representative Western blot, are also shown in bottom panel (right). Total levels of BDNF comparable to those of wild-type BDNF (+/+) littermates; data were normalized to beta-actin and represent mean ± S.E.M. of normalized optical densities for 5 mice per group. (B) Sample images depicting the fate of OSN axon terminal arbors in LF-TeTxLC (top panel), control LF-tauLacZ (bottom panel), in wild-type, BDNF(met/met) and BDNF(val/val) knock-in mice at P14. Scale bar, 20 μm. (C, D) Quantitation of OSN terminal arbor complexity in control LF-tauLacZ and LF-TeTxLC mice, in BDNF(met/met) and BDNF(val/val), as well as in littermate BDNF (+/+) control mice (n = 5 mice per genotype) at P14. C: number of branch points; D: total branch length. Note that results from wild-type mouse BDNF (+/+) littermate mice from the two crosses were pooled since they showed identical patterns of terminal arborization. (E) Analysis of LAV density in OSN terminal arbor in BDNF(met/met) and BDNF(val/val), as well as in littermate BDNF (+/+) control mice crossed to LF-TeTxLC or LF-tauLacZ lines. Double asterisks indicate P < 0.01.
Figure 6
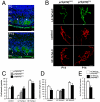
Figure 6. p75(NTR) levels influence competition-driven terminal axon arborization
(A) p75(NTR) immunoreactivity (green signal) in OB. p75(NTR) immunoreactivity was detected within glomeruli, as well as in the soma of some periglomerular cells (representative arrowheads) and in ensheathing glia (asterisk). Note the absence of immunoreactivity from the mitral cell layer. MCL: mitral cell layer; EPL: external plexiform layer; GL: glomerular layer; ONL: outer nerve layer. Scale bar, 50 μm. (B) Sample images depicting the fate of OSN axon terminal arbors in LF-TeTxLC (top panel), control wild-type (middle panel), or HF-TeTxLC (bottom panel) transgenic mice in the presence or absence of the p75(NTR) mutation, at P14. Scale bar, 20 μm. (C, D) Quantitation of OSN terminal arbor complexity in control mice, LF-TeTxLC or HF-TeTxLC transgenic mice, in either heterozygous p75(NTR) (+/-), homozygous p75(NTR) (-/-) or wild-type p75(NTR) (+/+) (n = 6 mice in each genotype) at P14. C: number of branch points; D: total branch length. (E) Analysis of LAV density in OSN terminal arbor in p75(+/+) or p75(-/-) ; LF-TeTxLC mice. Single asterisk indicates P < 0.05 and double asterisks indicate P < 0.01.

Similar articles

Cited by

References

    1. Goda Y, Davis GW. Mechanisms of synapse assembly and disassembly. Neuron. 2003;40:243–264. - PubMed
    1. Buffelli M, Burgess RW, Feng G, Lobe CG, Lichtman JW, Sanes JR. Genetic evidence that relative synaptic efficacy biases the outcome of synaptic competition. Nature. 2003;424:430–434. - PubMed
    1. Ruthazer ES, Akerman CJ, Cline HT. Control of axon branch dynamics by correlated activity in vivo. Science. 2003;301:66–70. - PubMed
    1. Hua JY, Smear MC, Baier H, Smith SJ. Regulation of axon growth in vivo by activity-based competition. Nature. 2005;434:1022–1026. - PubMed
    1. Torborg CL, Feller MB. Spontaneous patterned retinal activity and the refinement of retinal projections. Prog Neurobiol. 2005;76:213–235. - PubMed

Publication types

MeSH terms

Substances