

The structure of the ATP-bound state of S. cerevisiae phosphofructokinase determined by cryo-electron microscopy
- PMID: 17493831
- PMCID: PMC3586225
- DOI: 10.1016/j.jsb.2007.03.004
The structure of the ATP-bound state of S. cerevisiae phosphofructokinase determined by cryo-electron microscopy
Abstract
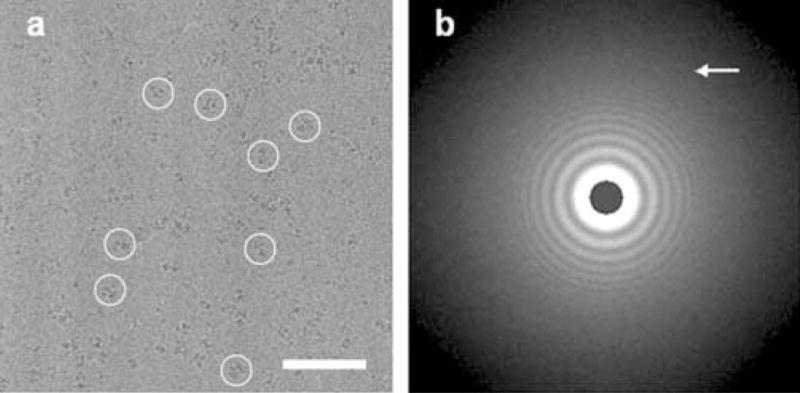
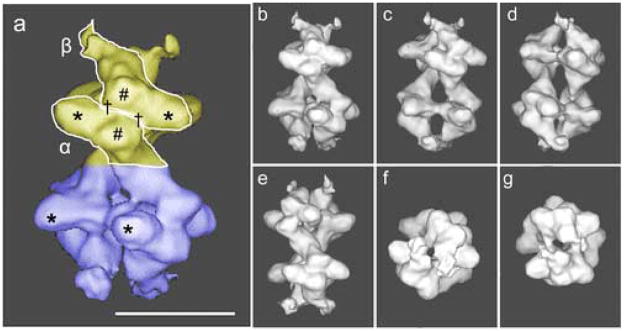
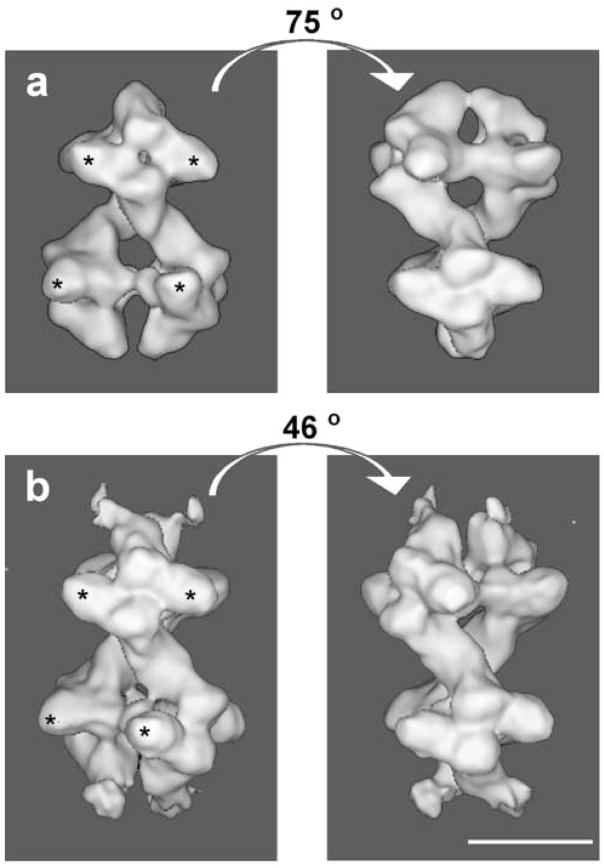
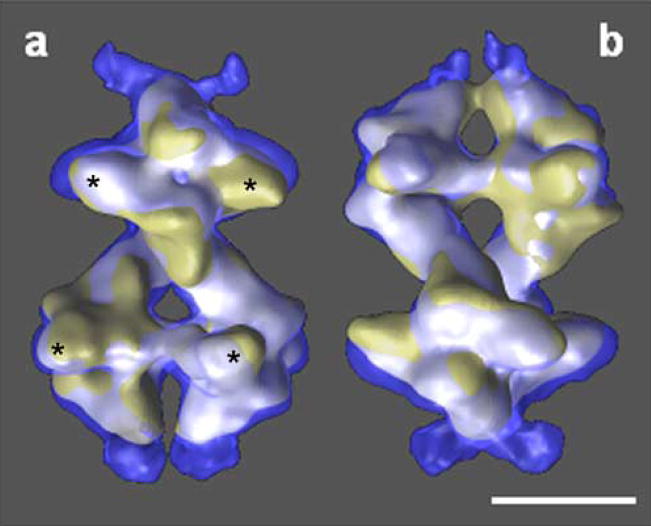
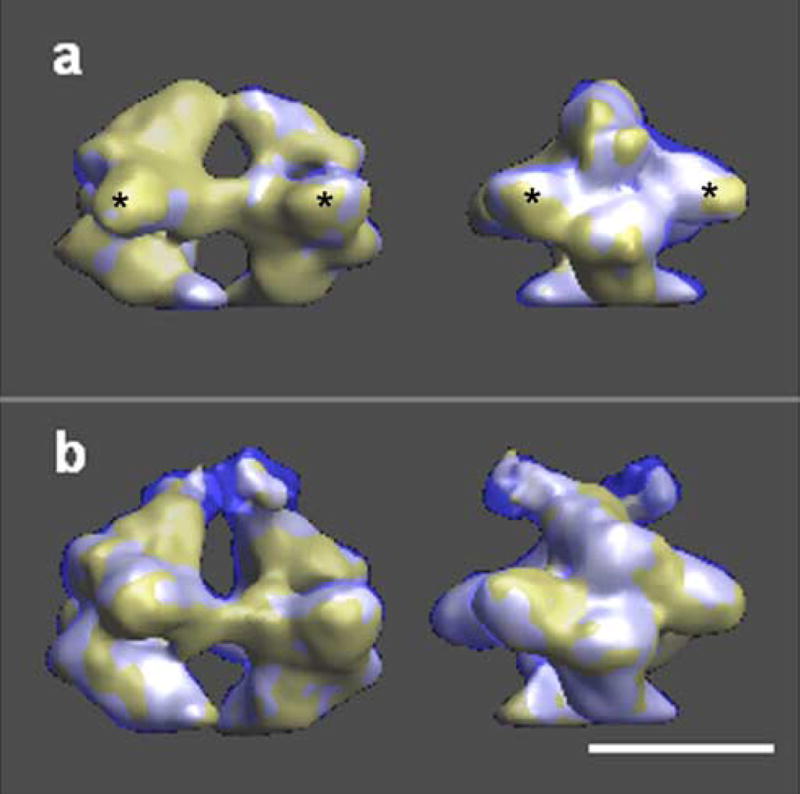
Phosphofructokinase (Pfk1, EC 2.7.1.11) plays a key regulatory role in the glycolytic pathway. The combination of X-ray crystallographic and biochemical data has provided an understanding of the different conformational changes that occur between the active and inhibited states of the bacterial enzyme, and of the role of the two bacterial effectors. Eukaryotic phosphofructokinases exhibit a far more sophisticated regulatory mechanism, they are more complex structures regulated by a large number of effectors (around 20). Saccharomyces cerevisiae Pfk1 is an 835 kDa hetero-octamer which shows cooperative binding for fructose-6-phosphate (F6P) and non-cooperative binding for ATP. The 3D structure of the F6P-bound state was obtained by cryo-electron microscopy to 1.1 nm resolution. This electron microscopy structure, in combination with molecular replacement using the bacterial enzyme has helped provide initial phases to solve the X-ray structure of the F6P-bound state 12S yeast truncated-tetramer. Biochemical and small-angle X-ray scattering (SAXS) studies had indicated that Pfk1 underwent a large conformational change upon Mg-ATP binding. We have calculated a reconstruction using reference-based 3D projection alignment methods from 0 degrees images acquired from frozen-hydrated preparations of the enzyme in the presence of Mg-ATP. The ATP-bound structure is more extended or open, and the calculated radius of gyration of 7.33 nm (7.0 nm for F6P) is in good agreement with the SAXS data. There is a substantial decrease in the rotational angle between the top and bottom tetramers. Interestingly, all these changes have arisen from a reorientation of the alpha- and beta-subunits in the dimers. The interface region between the alpha- and beta-subunits is now approximately half the size of the one in the F6P-bound structure. This is the first time that the 3D structure of a eukaryotic Pfk1 has been visualized in its T-state (inhibited-state).
Figures

Similar articles
-
Structures of S. pombe phosphofructokinase in the F6P-bound and ATP-bound states.J Struct Biol. 2007 Sep;159(3):498-506. doi: 10.1016/j.jsb.2007.06.001. Epub 2007 Jun 15. J Struct Biol. 2007. PMID: 17643314 Free PMC article.
-
The 10.8-A structure of Saccharomyces cerevisiae phosphofructokinase determined by cryoelectron microscopy: localization of the putative fructose 6-phosphate binding sites.J Struct Biol. 2003 Aug;143(2):124-34. doi: 10.1016/s1047-8477(03)00140-0. J Struct Biol. 2003. PMID: 12972349
-
The first three-dimensional structure of phosphofructokinase from Saccharomyces cerevisiae determined by electron microscopy of single particles.J Struct Biol. 2001 Dec;136(3):167-80. doi: 10.1006/jsbi.2002.4440. J Struct Biol. 2001. PMID: 12051897
-
A single point mutation leads to an instability of the hetero-octameric structure of yeast phosphofructokinase.Biochem J. 1999 Jul 1;341 ( Pt 1)(Pt 1):15-23. Biochem J. 1999. PMID: 10377240 Free PMC article.
-
Phosphofructokinase: structure and control.Philos Trans R Soc Lond B Biol Sci. 1981 Jun 26;293(1063):53-62. doi: 10.1098/rstb.1981.0059. Philos Trans R Soc Lond B Biol Sci. 1981. PMID: 6115424
Cited by
-
Monitoring Intracellular Metabolite Dynamics in Saccharomyces cerevisiae during Industrially Relevant Famine Stimuli.Metabolites. 2022 Mar 18;12(3):263. doi: 10.3390/metabo12030263. Metabolites. 2022. PMID: 35323706 Free PMC article.
-
Probabilistic principal component analysis with expectation maximization (PPCA-EM) facilitates volume classification and estimates the missing data.J Struct Biol. 2010 Jul;171(1):18-30. doi: 10.1016/j.jsb.2010.04.002. Epub 2010 Apr 10. J Struct Biol. 2010. PMID: 20385241 Free PMC article.
-
Gcn5p and Ubp8p Affect Protein Ubiquitylation and Cell Proliferation by Altering the Fermentative/Respiratory Flux Balance in Saccharomyces cerevisiae.mBio. 2020 Aug 11;11(4):e01504-20. doi: 10.1128/mBio.01504-20. mBio. 2020. PMID: 32788380 Free PMC article.
-
Correlation of the amino-acid sequence and the 3D structure of the functional domain of EmaA from Aggregatibacter actinomycetemcomitans.J Struct Biol. 2012 Feb;177(2):439-46. doi: 10.1016/j.jsb.2011.11.024. Epub 2011 Dec 2. J Struct Biol. 2012. PMID: 22155288 Free PMC article.
-
Structures of S. pombe phosphofructokinase in the F6P-bound and ATP-bound states.J Struct Biol. 2007 Sep;159(3):498-506. doi: 10.1016/j.jsb.2007.06.001. Epub 2007 Jun 15. J Struct Biol. 2007. PMID: 17643314 Free PMC article.
References
-
- Blangy D. Phosphofructokinase from E. coli: Evidence for a tetrameric structure of the enzyme. FEBS Letters. 1968;2:109–111. - PubMed
-
- Evans PR. Regulation of proteins by ligands. Houston; Texas: 1992. Activity and allosteric regulation in bacterial phosphofructokinase; pp. 39–54.
-
- Evans PR, Farrants GW, Lawrence MC. Crystallographic structure of allosterically inhibited phosphofructokinase at 7 A resolution. Journal of Molecular Biology. 1986;191:713–20. - PubMed
-
- Evans PR, Hudson PJ. Structure and control of phosphofructokinase from Bacillus stearothermophilus. Nature. 1979;279:500–4. - PubMed
-
- Frank J, Radermacher M, Penczek P, Zhu J, Li Y, Ladjadj M, Leith A. SPIDER and WEB: processing and visualization of images in 3D electron microscopy and related fields. Journal of Structural Biology. 1996;116:190–9. - PubMed
Publication types
MeSH terms
Substances
Grants and funding
LinkOut - more resources
Full Text Sources
Molecular Biology Databases
