. 2007 Jul;98(1):360-73.
doi: 10.1152/jn.00252.2007. Epub 2007 May 9.

Dissociation of eye and head components of gaze shifts by stimulation of the omnipause neuron region

Affiliations

Dissociation of eye and head components of gaze shifts by stimulation of the omnipause neuron region

Neeraj J Gandhi et al. J Neurophysiol. 2007 Jul.

Abstract

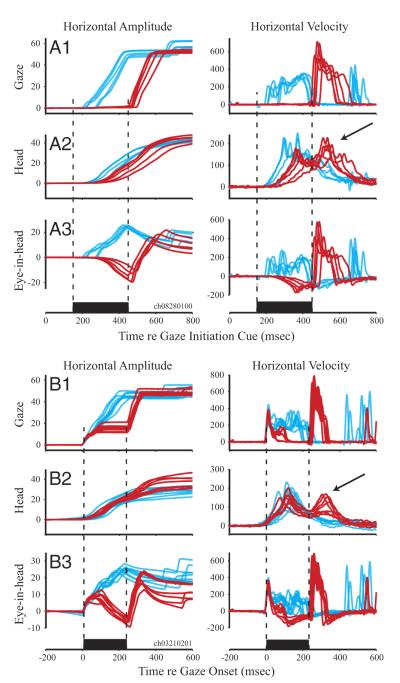
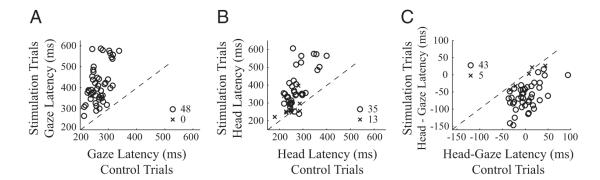
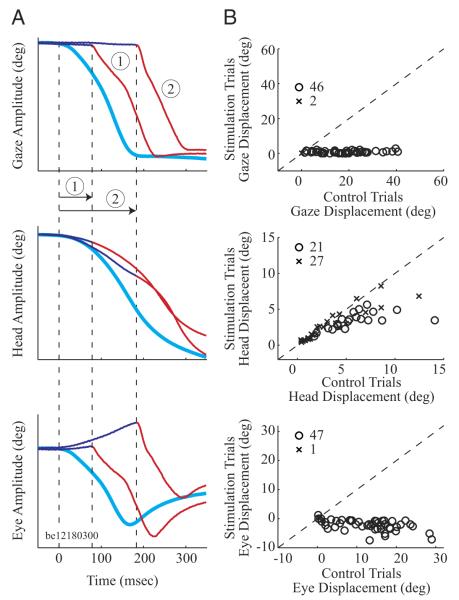
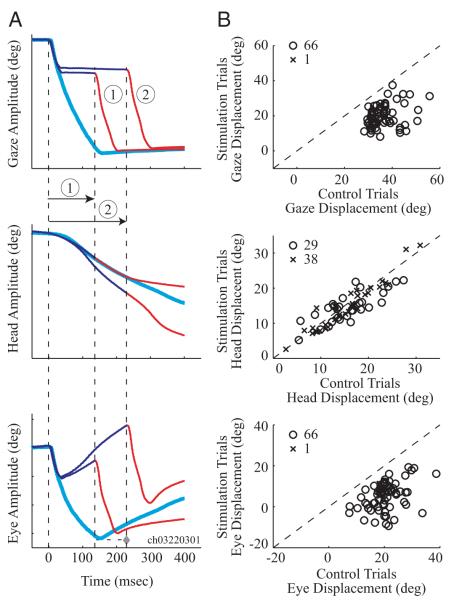
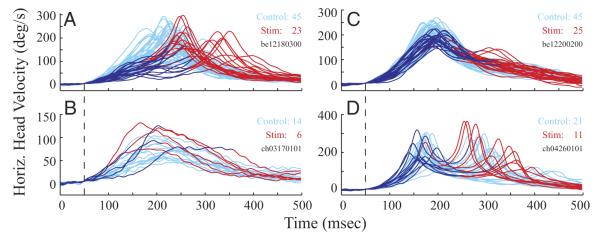
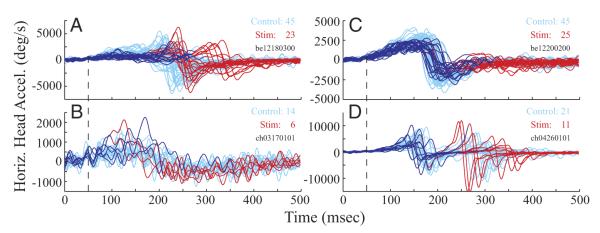
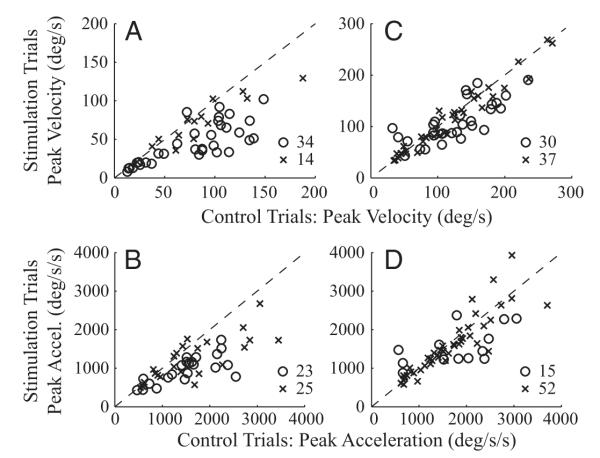
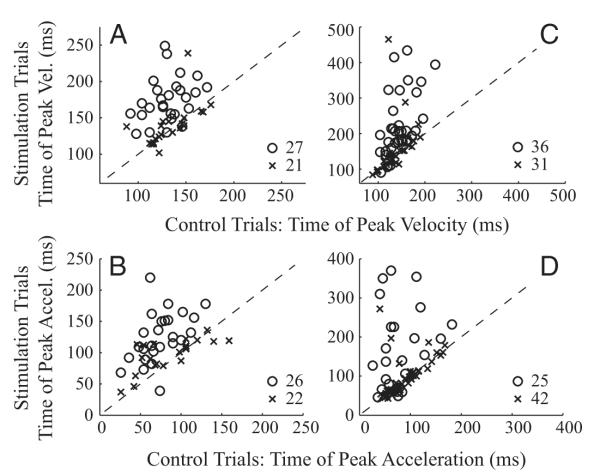
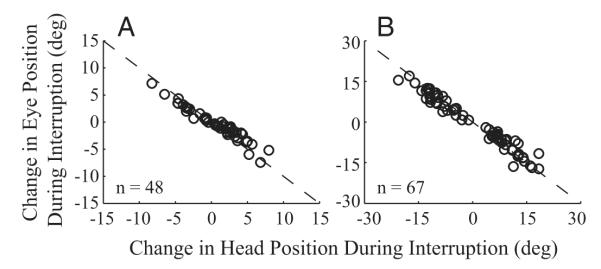
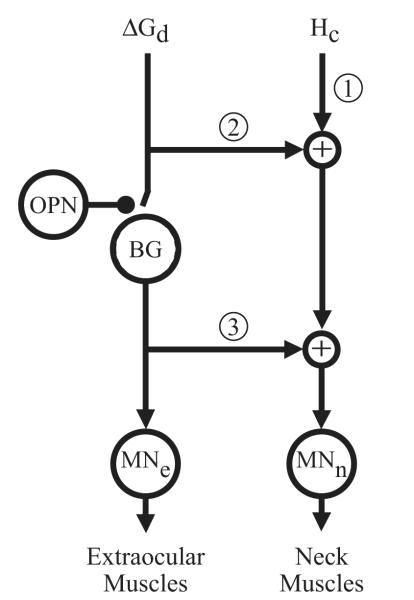
Natural movements often include actions integrated across multiple effectors. Coordinated eye-head movements are driven by a command to shift the line of sight by a desired displacement vector. Yet because extraocular and neck motoneurons are separate entities, the gaze shift command must be separated into independent signals for eye and head movement control. We report that this separation occurs, at least partially, at or before the level of pontine omnipause neurons (OPNs). Stimulation of the OPNs prior to and during gaze shifts temporally decoupled the eye and head components by inhibiting gaze and eye saccades. In contrast, head movements were consistently initiated before gaze onset, and ongoing head movements continued along their trajectories, albeit with some characteristic modulations. After stimulation offset, a gaze shift composed of an eye saccade, and a reaccelerated head movement was produced to preserve gaze accuracy. We conclude that signals subject to OPN inhibition produce the eye-movement component of a coordinated eye-head gaze shift and are not the only signals involved in the generation of the head component of the gaze shift.


Figures

FIG. 1
FIG. 1
Temporal representation of effects of stimulation of the omnipause neuron (OPN) region on head-unrestrained gaze shifts. Horizontal amplitude (left) and velocity (right) are plotted as a function of time for rightward gaze shifts directed to a target that was briefly flashed at a 60° eccentricity in tangential coordinates. Several, individual control trials are shown in cyan and stimulation trials are shown in red. A, 1–3: effect of stimulation delivered prior to the onset of gaze shifts. Panels plot the gaze, head, and eye-in-head components of coordinated eye-head movements. The trials are aligned on target onset. For the 5 stimulation trials shown here, stimulation onset occurred 150 ms after target onset and lasted for 300 ms. B, 1–3: effect of stimulation triggered on the onset of gaze shifts. Panels plot the gaze, head, and eye-in-head components, each aligned on gaze onset, as a function of time. Stimulation was triggered as either gaze or head position left its computer controlled window around the fixation point. Stimulation duration for the illustrated red trials was 250 ms. Datasets shown in A and B have the same target configuration and were collected from the same stimulation site in 1 animal. →, reacceleration of head movements that accompany gaze shifts after stimulation offset. Also note that the gaze and eye velocity traces illustrated in this figure do not show the dual-peak modulation reported previously (Freedman and Sparks 2000). We speculate that this effect is most robust during visually guided movements. The movements illustrated here were performed in the memory-guided task, and the absence of visual information is shown to reduce peak velocity, at least of head-restrained saccades (Edelman and Goldberg 2003 excitatory postsynaptic potential). A preliminary examination of the appropriate data collected in the gap task was comparable to the modulation in movement kinematics (data not shown).
FIG. 2
FIG. 2
The effect of stimulation of the OPN region on latency. Gaze latency (A), head latency (B), and head-gaze (C) onset times are compared for stimulation vs. control conditions when stimulation was triggered before gaze onset. A negative value of head-gaze latency indicates that the head movement preceded gaze onset. Each point represents a dataset (n = 48). Statistically significant datasets (○), based on a rank-sum test (P < 0.05) are differentiated from nonsignificant datasets (×). - - -, unity slope.
FIG. 3
FIG. 3
Analysis of the change in position observed when stimulation was delivered before gaze onset. A: schematics of gaze (top), head (middle), and eye in head (bottom) for an averaged control gaze shift (thick, cyan traces) and 2 individual stimulation trials (thin traces shown in blue and red) from the same dataset. The traces are aligned on head onset (leftmost vertical dashed line). For each of the 2 illustrations of stimulation trials, the initial component is shown in blue but is changed to red and also marked by a vertical line at the time of gaze onset (post stimulation offset). The change in gaze, head, and eye-in-head positions traversed by the control and each stimulation trial for its designated interval was determined. This method produced 2 distributions (control and stimulation conditions) of displacements each for gaze, head, and eye-in-head components. Note that the amplitude scale is intentionally omitted because the traces are meant to represent schematics. B: paired displacement measures for the control and stimulation subsets were averaged for each dataset and compared for gaze (top), head (middle), and eye-in-head (bottom) components. Each point corresponds to one dataset. Statistically significant datasets (open circle), based on a sign-rank test (P < 0.05), are differentiated from nonsignificant datasets (cross). The diagonal dashed lines indicate unity slope.
FIG. 4
FIG. 4
Analysis of the change in position observed when stimulation was triggered on gaze onset. A: schematics of gaze (top), head (middle), and eye in head (bottom) for an averaged control gaze shift (thick, cyan traces) and 2 individual stimulation trials (thin traces shown in blue and red) from the same dataset. The traces are aligned on gaze onset (leftmost vertical dashed line). For each of the 2 illustrations of stimulation trials, the initial component is shown in blue but is changed to red and also marked by a vertical line at the time of resumed gaze shift (post stimulation offset). The change in gaze, head, and eye-in-head positions traversed by the control and each stimulation trial for its designated interval was determined. This method yielded 2 distributions (control and stimulation conditions) of displacements each for gaze, head, and eye-in-head components. B: paired displacement measures for the control and stimulation subsets were averaged for each dataset and compared for gaze (top), head (middle), and eye-in-head (bottom) components. Each point corresponds to one dataset. Statistically significant datasets (open circle), based on a sign-rank test (P < 0.05), are differentiated from nonsignificant datasets (cross). The diagonal dashed lines indicate unity slope.
FIG. 5
FIG. 5
Temporal evolution of horizontal head velocity. Each panel shows control (cyan) and stimulation (red, blue) trials aligned on head onset, marked by the vertical dashed lines. A and B: data from 2 datasets for which stimulation was delivered before gaze onset. The component of head movement that preceded gaze onset in each stimulation trace is shown in blue; this epoch corresponds to the interval marked by the vertical dashed lines in Fig. 3A. The remainder of the trial is shown in red. C and D: data from 2 datasets for which stimulation was triggered on gaze onset. For each stimulation trial, the interval from initial gaze onset to resumed gaze onset is overlaid in blue; the rest of each trial is shown in red. These datasets were chosen to illustrate cases where stimulation did (top) and did not (bottom) attenuate the head movement.
FIG. 6
FIG. 6
Temporal evolution of horizontal head acceleration during control and stimulation conditions. The datasets and figure format are the same as in Fig.5.
FIG. 7
FIG. 7
A comparison of peak head velocity (A and C) and peak head acceleration (B and D) in the control and stimulation conditions. The peak value was computed across the “blue” component of each stimulation trace (Figs. 5 and 6) and the same interval of an averaged control movement. The control and stimulation values for each dataset were averaged and compared across all datasets. Thus each point corresponds to one dataset. Statistically significant datasets (○), based on a sign-rank test (P < 0.05), are differentiated from nonsignificant datasets (×). - - -, unity slope. Left and right: data represent the conditions when stimulation was delivered before and after gaze onset, respectively.
FIG. 8
FIG. 8
A comparison of the times of peak head velocity (A and C) and peak head acceleration (B and D). The figure has the same format as Fig. 7 but with 1 major exception. The times of the peak magnitudes were determined over the duration of the blue trials (Figs. 5 and 6) plus another 100 ms (see text for details).
FIG. 9
FIG. 9
An indirect evaluation of the counter-rotation gain, which presumably reflects the vestibuloocular reflex (VOR) gain, was assessed by comparing the change in eye position as a function of the head displacement traversed during the stimulation-induced interruption in gaze. A: when stimulation was delivered before gaze onset, the changes in eye-in-head and head-in-space positions were measured over the interval from head onset to gaze onset (the region marked by the vertical dashed lines in Fig. 3A). B: when stimulation was triggered on gaze onset, the measurements were made across the interval starting at the end of the initial gaze shift and ending at the onset of the resumed gaze shift. Each point represents the average changes in eye and head positions for each dataset.
FIG. 10
FIG. 10
Simplified schematic of the flow of neural signals involved in generating coordinated eye-head movements. Two partially independent pathways provide input signals. A head-movement command (Hc) provides one drive to the neck muscles (pathway 1), but the functional importance of this pathway during gaze shifts has yet to be determined. A desired gaze-displacement command (ΔGd) contributes to producing the saccadic eye and head components of the gaze shift. One possibility (pathway 2) is that ΔGd is dissociated into separate eye and head commands before the burst generator (BG), which in turn provides a drive to only the extraocular motoneurons (MNe). Thus no subset of the ΔGd drive to the neck muscles is gated by the OPNs. Another scenario (pathway 3) is that the separation of ΔGd into separate eye and head pathways occurs after the burst generator elements. Note that pathways 2 and 3 need not be mutually exclusive. MNn, neck motoneurons.

Similar articles

Cited by

References

    1. Becker W. Saccades. In: Carpenter RHS, editor. Eye Movements. Macmillan; London: 1991. pp. 95–137.
    1. Becker W, Jürgens R. Gaze saccades to visual targets: does head movement change the metrics. In: Berthoz A, Graf W, Vidal PP, editors. The Head-Neck Sensory Motor System. Oxford Univ. Press; New York: 1992. pp. 427–433.
    1. Becker W, King WM, Fuchs AF, Jürgens R, Johanson G, Kornhuber HH. Accuracy of goal-directed saccades and mechanisms of error correction. In: Fuchs AF, Becker W, editors. Progress in Oculomotor Research. Elsevier; New York: 1981. pp. 29–37.
    1. Bergeron A, Guitton D. Fixation neurons in the superior colliculus encode distance between current and desired gaze positions. Nat Neurosci. 2000;3:932–939. - PubMed
    1. Bergeron A, Guitton D. In multiple-step gaze shifts: omnipause (OPNs) and collicular fixation neurons encode gaze position error; OPNs gate saccades. J Neurophysiol. 2002;88:1726–1742. - PubMed

Publication types