. 2007 May 9;27(19):5224-35.
doi: 10.1523/JNEUROSCI.5169-06.2007.

Excitatory GABA action is essential for morphological maturation of cortical neurons in vivo

Affiliations

Excitatory GABA action is essential for morphological maturation of cortical neurons in vivo

Laura Cancedda et al. J Neurosci. .

Abstract

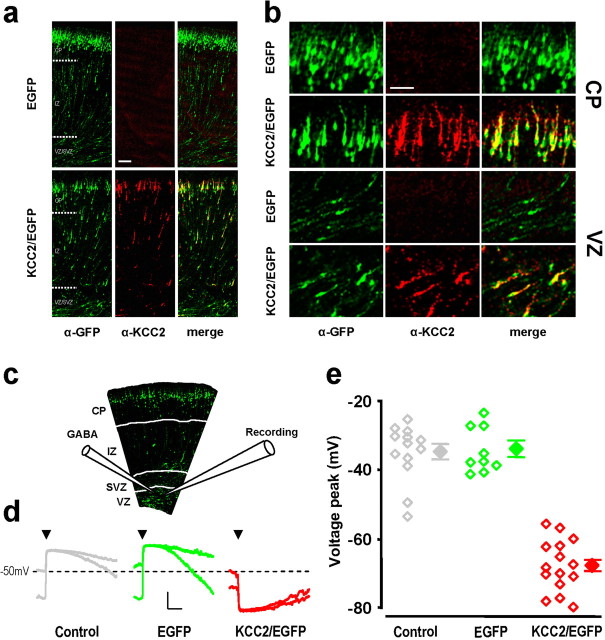
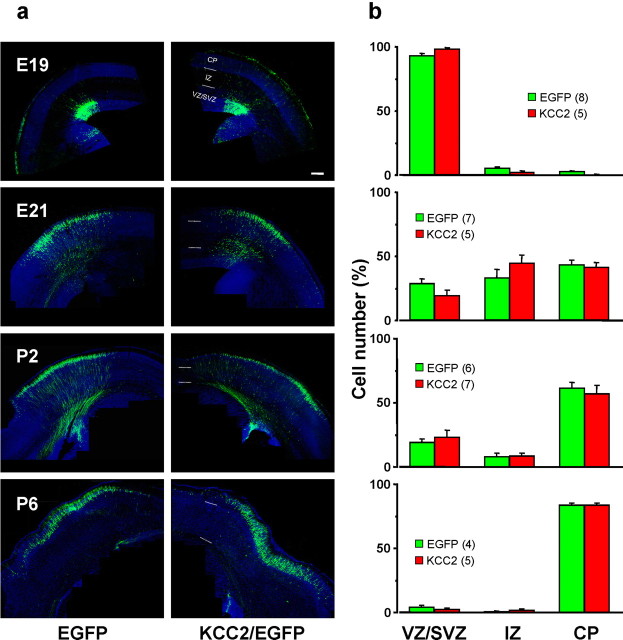
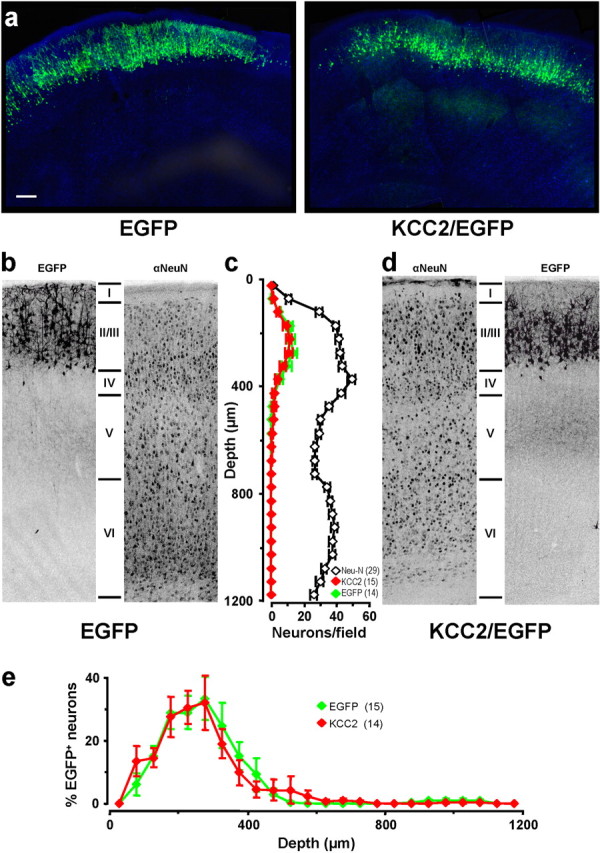
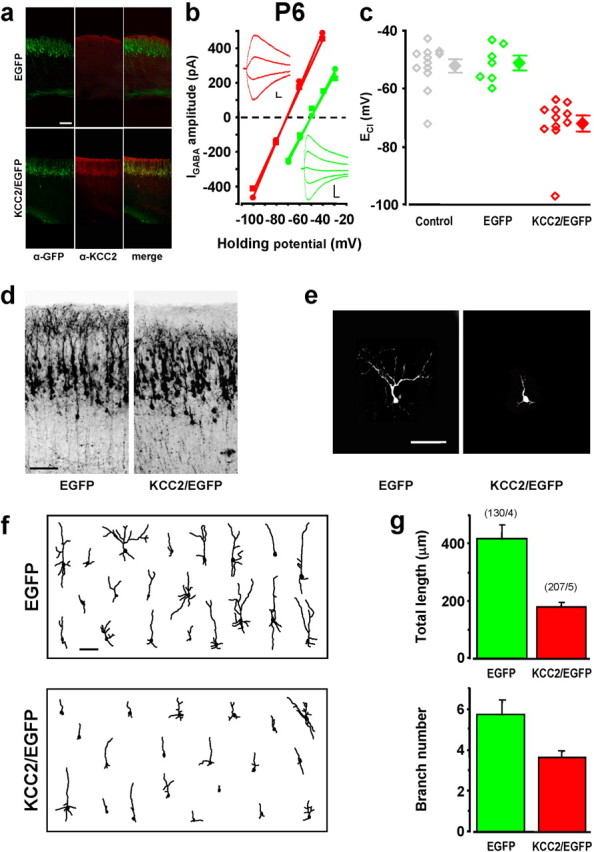
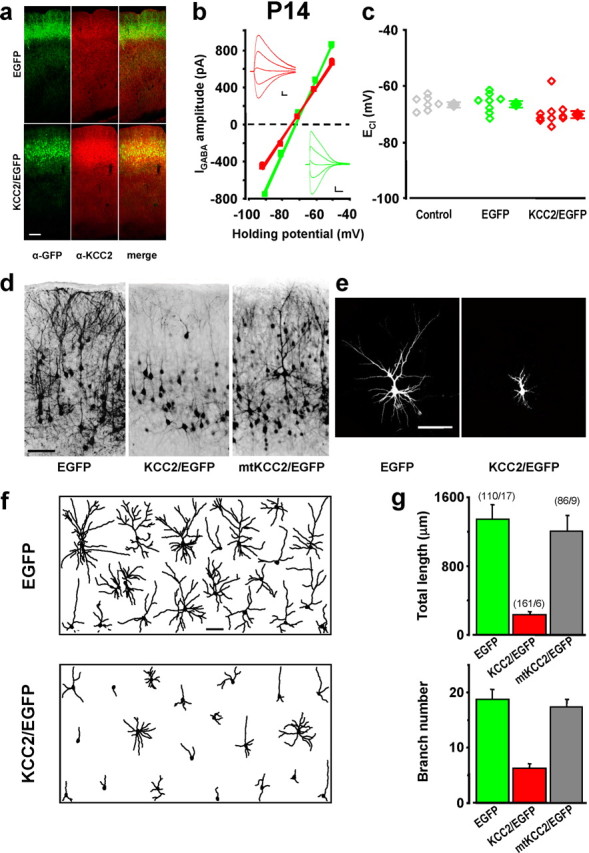
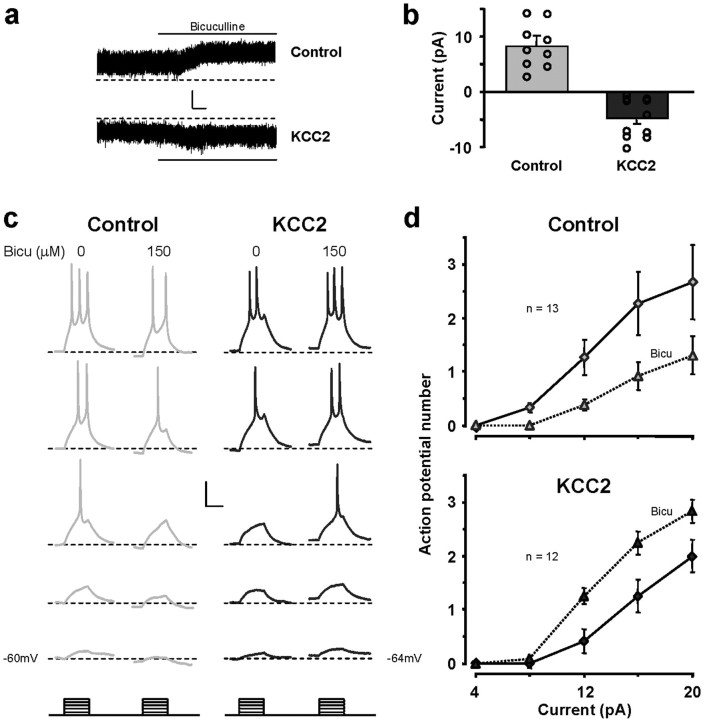
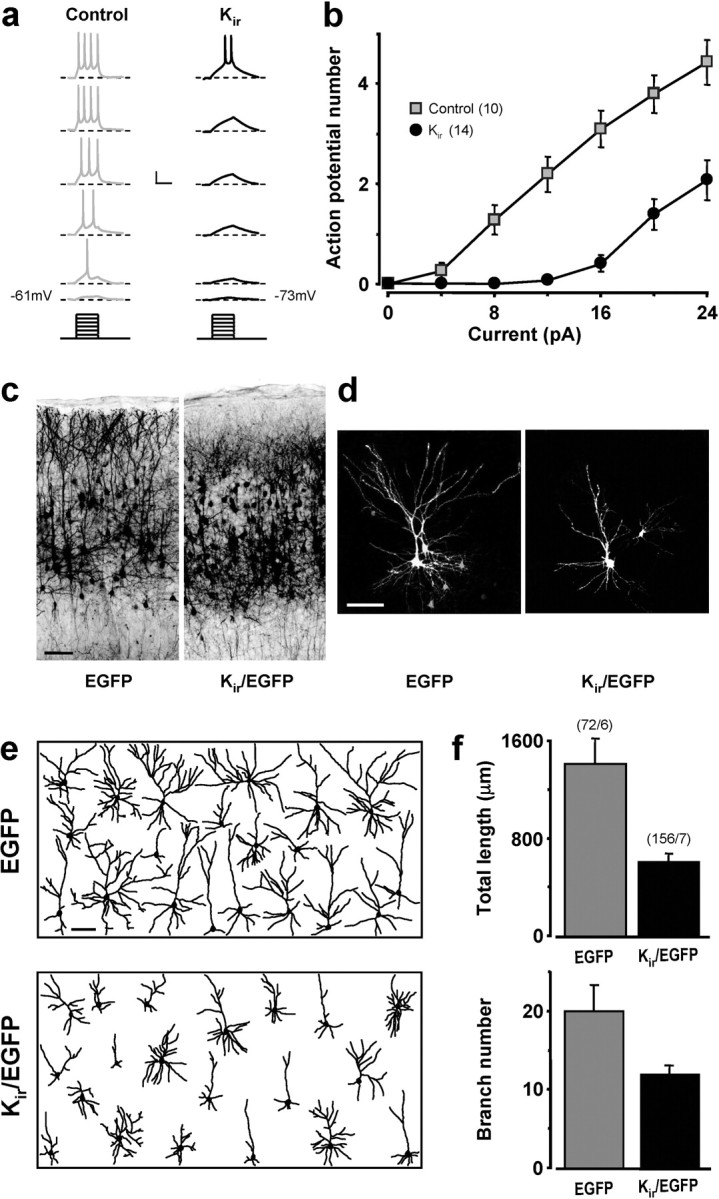
GABA exerts excitatory actions on embryonic and neonatal cortical neurons, but the in vivo function of this GABA excitation is essentially unknown. Using in utero electroporation, we eliminated the excitatory action of GABA in a subpopulation of rat ventricular progenitors and cortical neurons derived from these progenitors by premature expression of the Cl- transporter KCC2, as confirmed by the changes in the reversal potential of GABA-induced currents and the resting membrane potential after GABA(A) receptor blockade. We found that radial migration to layer II/III of the somatosensory cortex of neurons derived from the transfected progenitors was not significantly affected, but their morphological maturation was markedly impaired. Furthermore, reducing neuronal excitability of cortical neurons in vivo by overexpressing an inward-rectifying K+ channel, which lowered the resting membrane potential, mimicked the effect of premature KCC2 expression. Thus, membrane depolarization caused by early GABA excitation is critical for morphological maturation of neonatal cortical neurons in vivo.


Figures

Figure 1.
Figure 1.
Premature expression of KCC2 in cells in the VZ caused a positive shift in ECl. a, Confocal images of coronal sections of somatosensory cortices of P0 rats transfected via in utero electroporation with EGFP or KCC2/EGFP construct and immunostained for GFP and KCC2. KCC2 and EGFP were expressed in a subpopulation of neurons distributed throughout the developing cortex. White dotted lines mark boundaries between different regions of the developing cortex. Scale bar, 100 μm. b, Higher-magnification images of the CP (top two panels) and the VZ/SVZ (bottom two panels) as in a. Note colocalization of KCC2 and EGFP in KCC2/EGFP-transfected neurons. Scale bar, 50 μm. c, Schematic representation of the slice-recording configuration for ECl measurements at P0. d, Examples of membrane voltage responses elicited by puffing saturating concentration of GABA at the soma of VZ cells in acute slices of somatosensory cortex from P0 and P1 rats, which were transfected with KCC2/EGFP (red) or EGFP (green). Untransfected cells from the same slices were used as the control (gray). Two repeats with membrane potential current clamped at two different potentials were performed with a 1 min interval. Calibration: 500 ms, 10 mV. e, ECl values estimated by GABA puffing for P0 and P1 untransfected control neurons (gray) or neurons transfected with EGFP only (green) or with KCC2/EGFP (red). Each data point (open symbol) represents the result from one neuron, and the average value (±SEM) is indicated on the right. Data for KCC2/EGFP-transfected cells were significantly different from those for untransfected (control) or EGFP-transfected cells (p < 0.001, one-way ANOVA; p < 0.05, post hoc Holm-Sidak method).
Figure 2.
Figure 2.
Premature expression of KCC2 did not affect neuronal migration. a, Representative confocal images of coronal sections of rat somatosensory cortex at different days after in utero electroporation of the EGFP or KCC2/EGFP construct (at E17). Sections were immunostained for GFP (green) and counterstained with fluorescent Nissl stain (blue). White dotted lines mark boundaries between different regions of the developing cortex. Scale bar, 200 μm. b, Quantification of the number of neurons expressing either EGFP only (green) or KCC2/EGFP (red) residing at the VZ, IZ, or CP (marked in a) at different developmental ages, as a percentage of the total number of fluorescent cells in the same section. Data represent mean ± SEM. Data for KCC2/EGFP cells were not significantly different from those for EGFP-only cells observed at all ages (p > 0.001, one-way ANOVA). Numbers in parentheses refer to the total number of rats processed.
Figure 3.
Figure 3.
Premature expression of KCC2 did not affect cortical layering. a, Confocal images of coronal sections of P14 somatosensory cortex of rat transfected via in utero electroporation with KCC2/EGFP or EGFP. Slices were stained for the neuronal marker NeuN (blue) to highlight cortical layers. Scale bar, 200 μm. b, Representative images of EGFP fluorescence and NeuN immunofluorescence for a typical section of a P14 rat transfected with EGFP. c, The number of EGFP+ cells (in 50 μm bins) with respect to cortical depth in the EGFP and KCC2/EGFP-transfected animals. The number of NeuN+ cells was obtained by averaging the sections from KCC2/EGFP and EGFP animals, because they were not significantly different (p > 0.001, two-way ANOVA). d, Representative images of a typical section of a P14 rat transfected with KCC2/EGFP as in b. e, Accumulation of EGFP+ cells in different cortical layers, as indicated by the ratio of EGFP+ and NeuN+ cells at each 50 μm bin (from dataset in c) along the cortical axis. Numbers in parentheses represent the total number of rats analyzed.
Figure 4.
Figure 4.
GABA excitation was essential for morphological maturation. a, Confocal images of coronal sections of somatosensory cortices of P4 rats transfected via in utero electroporation with or KCC2/EGFP construct and immunostained for GFP and KCC2. Scale bar, 200 μm. b, Examples of I–V relationships for membrane current responses elicited by puffing GABA at the soma of layer II/III neurons in acute slices of somatosensory cortex from P4–P6 rats, which were transfected with KCC2/EGFP (red, 2 repeats spaced by 3 min) or EGFP (green). Insets, Sample traces of GABA-induced currents at different holding potentials. Calibration: 100 ms, 100 pA. c, ECl values determined by GABA puffing for P4–P6 neurons untransfected (gray) or transfected with EGFP only (green) or with KCC2/EGFP (red). Data points represent results from single neurons (open diamonds), and the average value (±SEM) is indicated on the right. Data for KCC2/EGFP-transfected cells were significantly different from that of untransfected (control) or EGFP-transfected cells (p < 0.001, one-way ANOVA; p < 0.05, post hoc Holm-Sidak method). d, Representative GFP immunostaining showing regions with a high density of EGFP-expressing neurons in layer II/III coronal sections of P6 somatosensory cortices, which were transfected with EGFP and KCC2/EGFP. Scale bar, 100 μm. e, Examples of the 2-D projection of confocal images of single neurons at P6 in regions with a low density of EGFP-expressing cells, from sections of rat cortices transfected with EGFP or KCC2/EGFP. Scale bar, 100 μm. f, Tracing of 2-D projection of the dendritic arbor of 20 randomly sampled neurons in layer II/III of P6 cortices transfected with EGFP or KCC2/EGFP. Scale bar, 100 μm. g, Total dendritic length and branch number of cortical neurons at P6 transfected with EGFP or KCC2/EGFP. Data represent mean ± SEM. For both parameters, the values of KCC2/EGFP-transfected cells were different from those of EGFP-transfected cells (p < 0.001, Kruskal–Wallis one-way ANOVA; p < 0.05, post hoc Dunn's method). Numbers in parentheses refer to the total number of cells/rats analyzed.
Figure 5.
Figure 5.
The effect of excitatory GABA on dendritic morphology observed at P14. a, Confocal images of coronal sections of somatosensory cortices of P14 rats transfected via in utero electroporation with EGFP or KCC2/EGFP construct and immunostained for GFP and KCC2. Scale bar, 200 μm. b, Examples of I–V relationships for membrane current responses elicited by puffing GABA at the soma of layer II/III neurons in acute slices of somatosensory cortex from P14 rats, which were transfected with KCC2/EGFP (red, 2 repeats spaced by 3 min) or EGFP (green). Insets, Sample traces of GABA-induced currents at different holding potentials. Calibration: 100 ms, 100 pA. c, ECl values determined by GABA puffing for P14 and P15 neurons untransfected (gray) or transfected with EGFP only (green) or with KCC2/EGFP (red), presented similarly to those of Figure 4c. Data for KCC2/EGFP cells were not significantly different from those for control or EGFP cells (p > 0.001, one-way ANOVA). d, Representative GFP immunostaining showing regions with a high density of EGFP-expressing neurons in layer II/III coronal sections of P14 somatosensory cortices, which were transfected with EGFP, KCC2/EGFP, or mtKCC2/EGFP. Scale bar, 100 μm. e, Examples of the 2-D projection of confocal images of single neurons at P14 in regions with a low density of EGFP-expressing cells, from sections of rat cortices transfected with EGFP or KCC2/EGFP. Scale bar, 100 μm. f, Tracing of the 2-D projection of the dendritic arbor of 20 randomly sampled neurons in layer II/III of P14 cortices transfected with EGFP or KCC2/EGFP. Scale bar, 100 μm. g, Total dendritic length and branch number of cortical neurons at P14, transfected with EGFP or KCC2/EGFP. Data represent mean ± SEM. For both parameters, the values of KCC2/EGFP-transfected cells were different from those of EGFP- and mtKCC2/EGFP-transfected cells (p < 0.001, Kruskal–Wallis one-way ANOVA; p < 0.05, post hoc Dunn's method), but no difference was found between EGFP and mtKCC2/EGFP cells (p > 0.05). Numbers in parentheses refer to the total number of cells/rats analyzed.
Figure 6.
Figure 6.
Measurements of tonic GABA actions on cortical neurons. a, Example recordings showing that bicuculline application (bar) resulted in a steady outward current in control cortical cells (top trace) but a steady inward current in KCC2/EGFP-expressing cells (bottom trace). Recordings were performed at P4–P6 from neurons in layer II/III of the somatosensory cortex. Calibration: 5 s, 10 pA. b, Summary of all data on tonic GABA-induced currents unmasked by the application of bicuculline. Open symbols represent single cases, and histograms represent mean ± SEM. The two sets of data were significantly different (p < 0.001, t test). c, Example recordings of membrane potential changes in untransfected control cortical cells (gray) or in KCC2/EGFP-expressing cells (black), in responses to graded (4 pA steps) depolarizing currents (bottom), before and after application of bicuculline (Bicu). Calibration: 200 ms, 20 mV. d, Input–output curves depicting the number of action potentials elicited by graded depolarizing currents before (solid line) and after (dotted line) bicuculline application, in untransfected control cells and KCC2/EGFP-expressing cells. Significant rightward and leftward shifts were found for these two groups of cells, respectively, after the bicuculline application (p < 0.05, Wilcoxon signed rank test). Recordings were performed at P5 and P6. n refers to the total number of cells recorded.
Figure 7.
Figure 7.
Kir2.1 overexpression reduced neuronal firing and impaired morphological maturation. a, Example recordings showing membrane voltage responses to graded steps (4 pA) of current injections (bottom), for untransfected control cells (gray) and Kir/EGFP-expressing cells (black). Calibration: 200 ms, 20 mV. b, Input–output curves for untransfected control cells and Kir/EGFP-expressing cells. Significant difference between the two groups of cells was found (p < 0.0001, one-way repeated-measures ANOVA; p < 0.05, post hoc Holm-Sidak method). Recordings were performed at P8. Numbers in parentheses refer to the total number of cells recorded. c–f, Data from experiments similar to that in Figure 4, except that neurons were transfected with Kir/EGFP instead of KCC2/EGFP. f, Both parameters were significantly different between the two groups (p < 0.001, Kruskal–Wallis one-way ANOVA; p < 0.05, post hoc Dunn's method).

Comment in

Similar articles

Cited by

References

    1. Asada H, Kawamura Y, Maruyama K, Kume H, Ding RG, Kanbara N, Kuzume H, Sanbo M, Yagi T, Obata K. Cleft palate and decreased brain gamma-aminobutyric acid in mice lacking the 67-kDa isoform of glutamic acid decarboxylase. Proc Natl Acad Sci USA. 1997;94:6496–6499. - PMC - PubMed
    1. Barbin G, Pollard H, Gaiarsa JL, Ben Ari Y. Involvement of GABAA receptors in the outgrowth of cultured hippocampal neurons. Neurosci Lett. 1993;152:150–154. - PubMed
    1. Behar TN, Li YX, Tran HT, Ma W, Dunlap V, Scott C, Barker JL. GABA stimulates chemotaxis and chemokinesis of embryonic cortical neurons via calcium-dependent mechanisms. J Neurosci. 1996;16:1808–1818. - PMC - PubMed
    1. Behar TN, Schaffner AE, Scott CA, O'Connell C, Barker JL. Differential response of cortical plate and ventricular zone cells to GABA as a migration stimulus. J Neurosci. 1998;18:6378–6387. - PMC - PubMed
    1. Behar TN, Scott CA, Greene CL, Wen X, Smith SV, Maric D, Liu QY, Colton CA, Barker JL. Glutamate acting at NMDA receptors stimulates embryonic cortical neuronal migration. J Neurosci. 1999;19:4449–4461. - PMC - PubMed

Publication types

MeSH terms

LinkOut - more resources