. 2007 May 9;27(19):5236-48.
doi: 10.1523/JNEUROSCI.3545-06.2007.

Differential regulation of endogenous N- and P/Q-type Ca2+ channel inactivation by Ca2+/calmodulin impacts on their ability to support exocytosis in chromaffin cells

Affiliations

Differential regulation of endogenous N- and P/Q-type Ca2+ channel inactivation by Ca2+/calmodulin impacts on their ability to support exocytosis in chromaffin cells

Robert C E Wykes et al. J Neurosci. .

Abstract

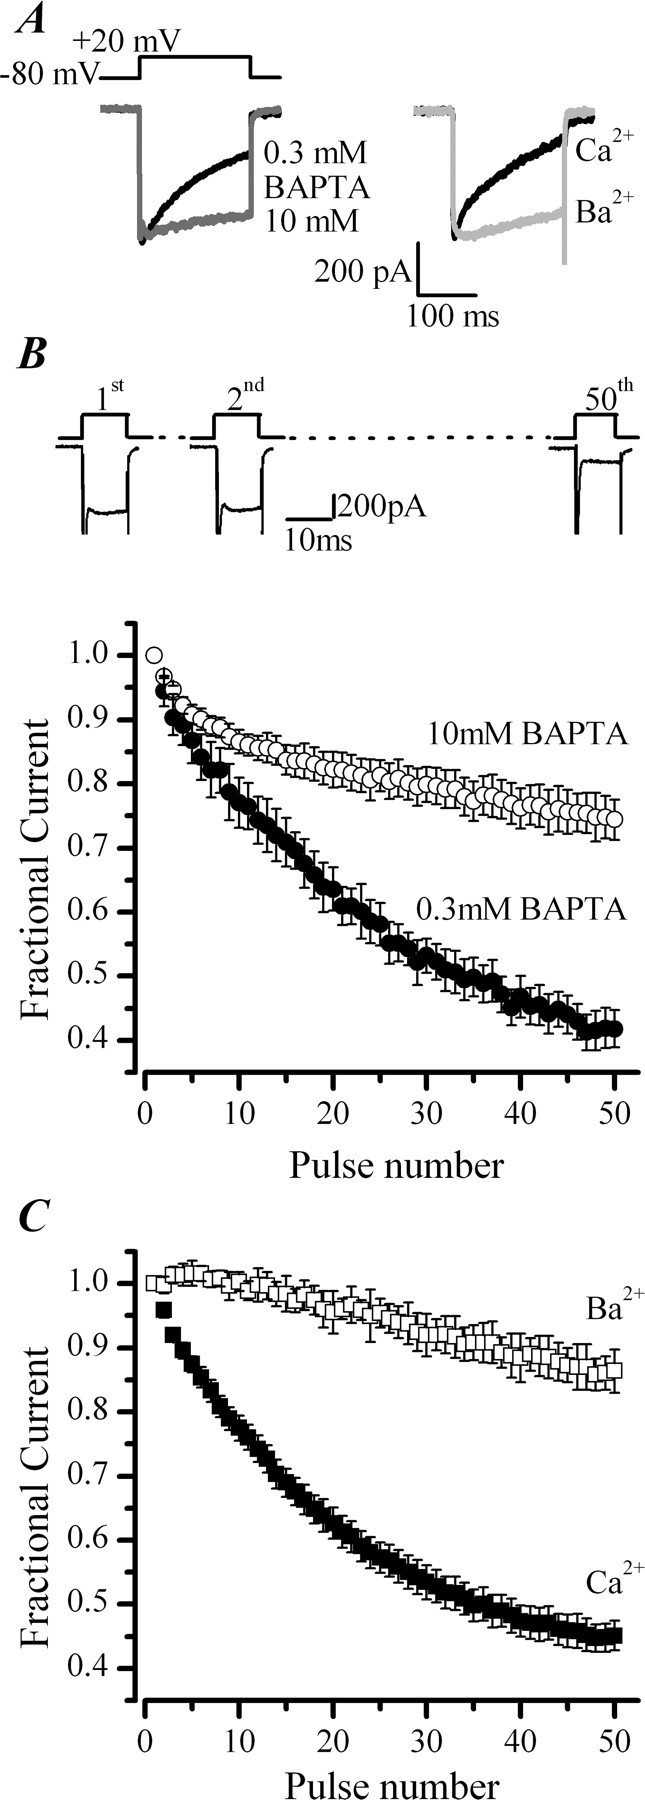
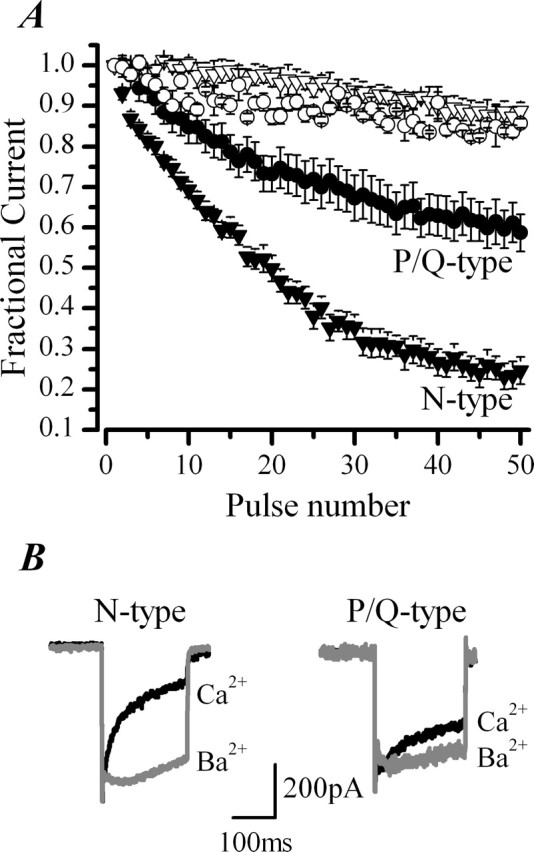
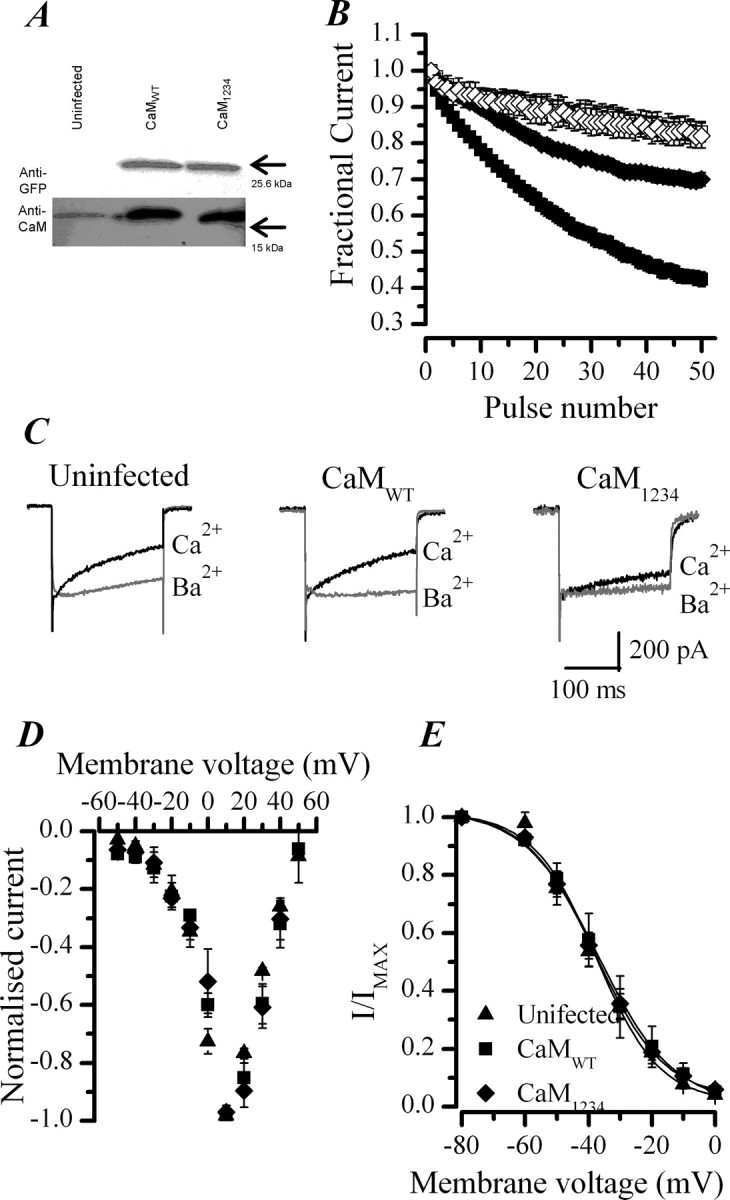
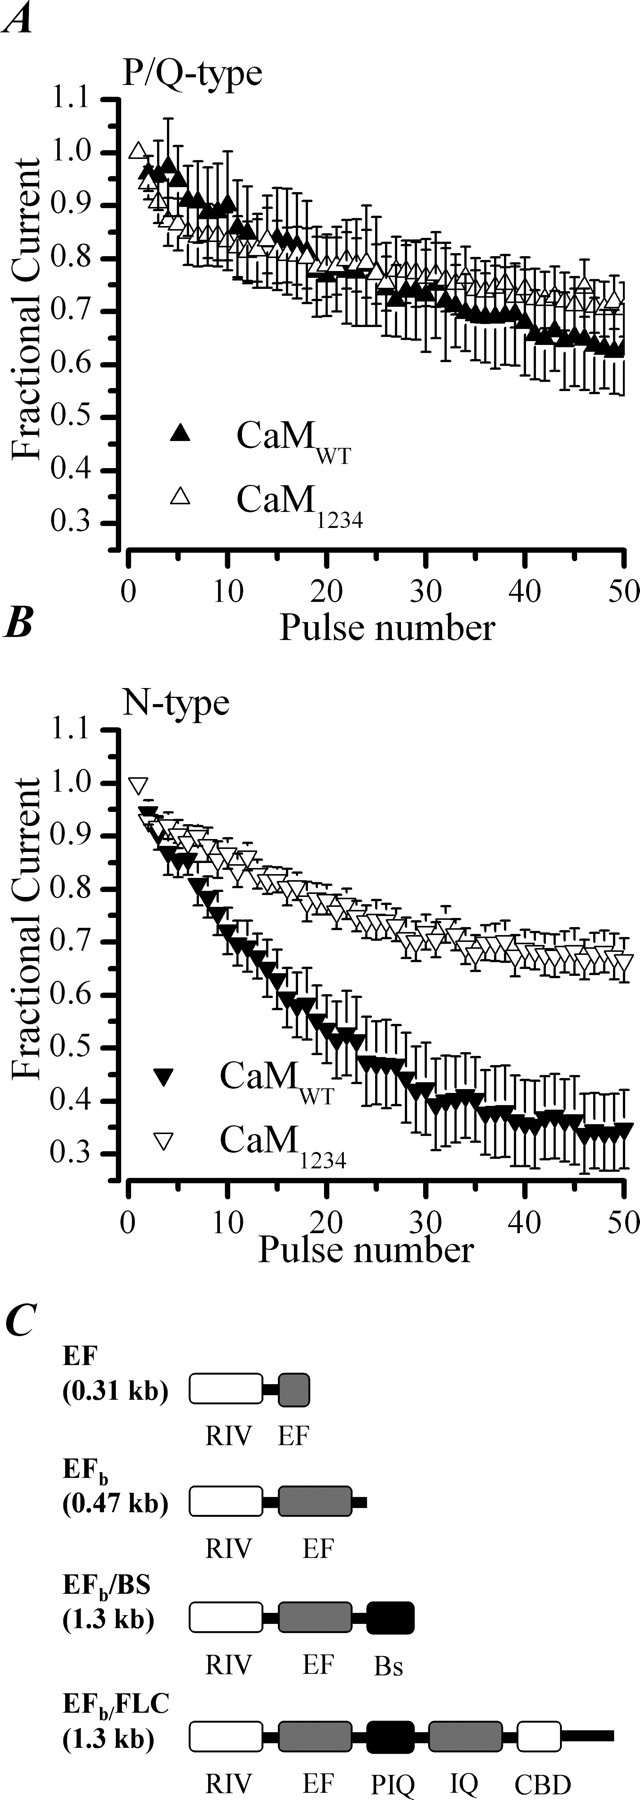
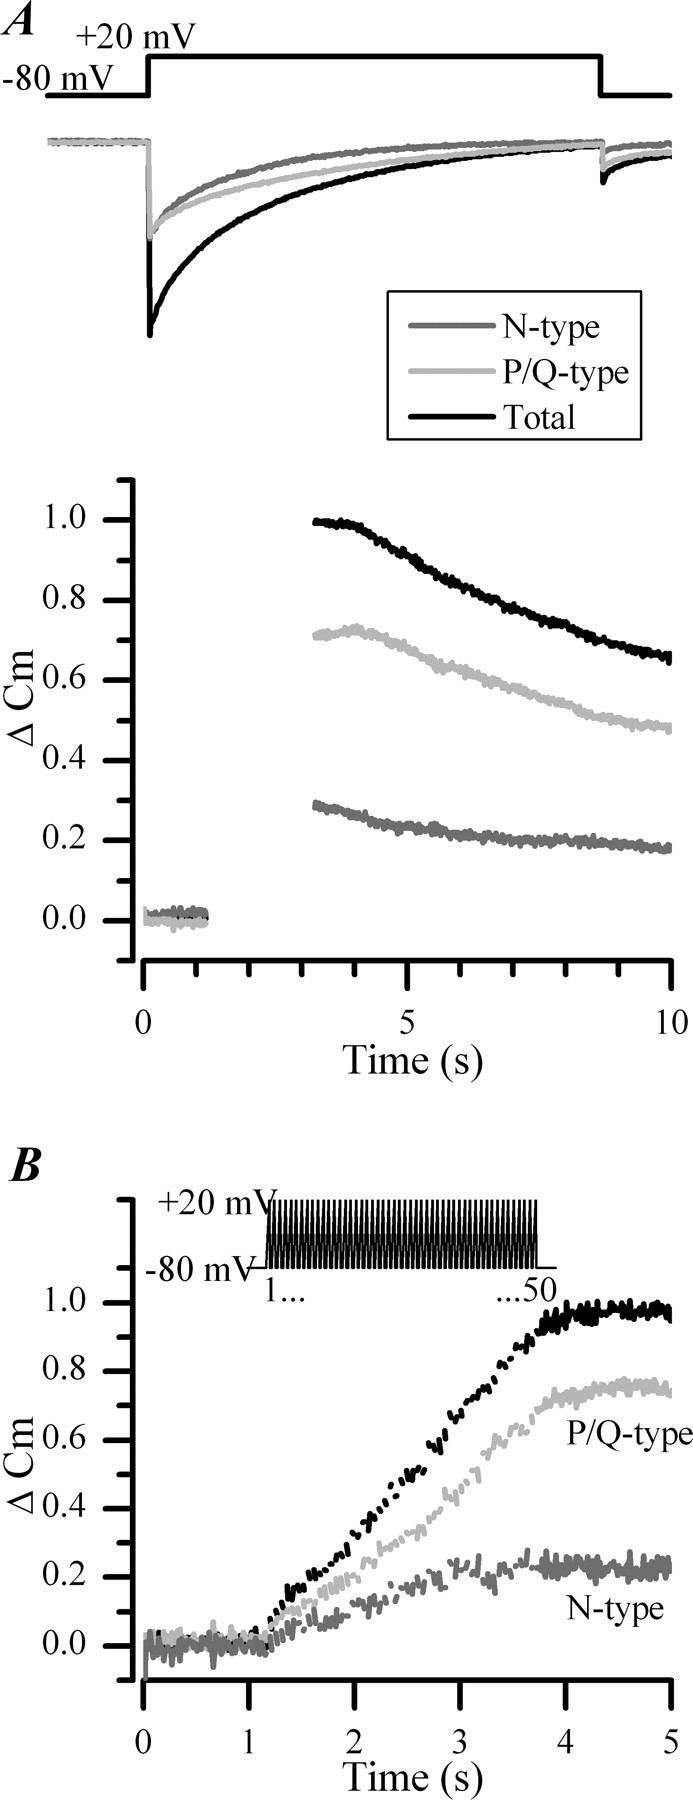
P/Q-type (Ca(V)2.1) and N-type (Ca(V)2.2) Ca2+ channels are critical to stimulus-secretion coupling in the nervous system; feedback regulation of these channels by Ca2+ is therefore predicted to profoundly influence neurotransmission. Here we report divergent regulation of Ca2+-dependent inactivation (CDI) of native N- and P/Q-type Ca2+ channels by calmodulin (CaM) in adult chromaffin cells. Robust CDI of N-type channels was observed in response to prolonged step depolarizations, as well as repetitive stimulation with either brief step depolarizations or action potential-like voltage stimuli. Adenoviral expression of Ca2+-insensitive calmodulin mutants eliminated CDI of N-type channels. This is the first demonstration of CaM-dependent CDI of a native N-type channel. CDI of P/Q-type channels was by comparison modest and insensitive to expression of CaM mutants. Cloning of the C terminus of the Ca(V)2.1 alpha1 subunit from chromaffin cells revealed multiple splice variants lacking structural motifs required for CaM-dependent CDI. The physiological relevance of CDI on stimulus-coupled exocytosis was revealed by combining perforated-patch voltage-clamp recordings of pharmacologically isolated Ca2+ currents with membrane capacitance measurements of exocytosis. Increasing stimulus intensity to invoke CDI resulted in a significant decrease in the exocytotic efficiency of N-type channels compared with P/Q-type channels. Our results reveal unexpected diversity in CaM regulation of native Ca(V)2 channels and suggest that the ability of individual Ca2+ channel subtypes to undergo CDI may be tailored by alternative splicing to meet the specific requirements of a particular cellular function.


Figures

Figure 1.
Figure 1.
CDI of ICa in chromaffin cells. A, Left, Representative ICa recorded in the whole-cell patch configuration with low and high BAPTA added to the pipette solution. A, Right, Representative ICa recorded under perforated-patch conditions before and after equimolar replacement of extracellular Ca2+ with Ba2+. B, Top, Schematic diagram of the voltage protocol and representative ICa recorded during the first two and final depolarization of a train of 50 pulses from −80 to +20 mV delivered at 20 Hz. Fractional current was calculated from the peak ICa measured for each pulse in the train, normalized to the peak ICa elicited by the first pulse in the train. Summary plot showing the effects of raising the intracellular Ca2+ chelator BAPTA from 0.3 mm (•; n = 7) to 10 mm (○; n = 5) on ICa evoked by the train protocol. C, Effect of replacing extracellular Ca2+ (■; n = 20) with equimolar Ba2+ (□; n = 3) on ICa evoked by the train protocol.
Figure 2.
Figure 2.
Pharmacological identification of VGCCs expressed by adult bovine chromaffin cells. A, Superimposed ICa from a representative chromaffin cell before and after 5 min application of the P/Q-type-selective inhibitor AgaIVA (300 nm) and N-type-selective inhibitor ω-CgTX (1 μm). B, Corresponding Cm recorded in the same cell. Gaps in the traces indicate timing of the depolarizing pulses during which capacitance detection is interrupted. Combined inhibition of N- and P/Q-type channels abolishes Ca2+ entry and exocytosis in adult bovine chromaffin cells. C, Mean ± SEM percentage inhibition in Ca2+ entry (determined by integration of ICa; hatched bars) and corresponding ΔCm (filled bars) resulting from combined application of AgaIVA (300 nm) and ω-CgTX (1 μm) (n = 3), the L-type channel inhibitor nimodipine (Nmdp; 10 μm, n = 3), or the N- and P/Q-type inhibitor ω-CgTX MVIIC (10 μm; n = 3).
Figure 3.
Figure 3.
CDI is more pronounced in N-type channels than P/Q-type channels in chromaffin cells. Replacement of extracellular Ca2+ with Ba2+ was used to probe CDI of pharmacologically isolated N- and P/Q-type channels. A, ICa was evoked with a train of 50 pulses of 10 ms duration from −80 to +20 mV, delivered at 20 Hz. Mean ± SEM data are from n = 10 cells recorded in perforated-patch conditions in either the presence of 300 nm AgaIVA to isolate N-type channels (▿, ▾) or 1 μm CgTX to isolate P/Q-type channels (○, •). Cells were stimulated first in control external solution (2.5 mm Ca2+) (▾, •) and then after equimolar replacement with Ba2+ (▿, ○). The difference in CDI between N-type and P/Q-type channels at the 50th pulse in Ca2+ is significantly different (p < 0.0001). B, Superimposed current traces of pharmacologically isolated N-type and P/Q-type channels recorded in response to a 200 ms depolarization from −80 to +20 mV before and after replacement of extracellular Ca2+ (black trace) with Ba2+ (gray trace). I200/Ipeak for N-type channels in Ca2+ was 40 ± 7% (n = 15) compared with 98 ± 1% (n = 3) in Ba2+ and for P/Q-type currents I200/Ipeak increased from 53 ± 6% (n = 15) in Ca2+ to 84 ± 3% (n = 5) in Ba2 +.
Figure 4.
Figure 4.
Adenovirus provides an efficient and nontoxic method for exogenous gene expression in chromaffin cells. A, The top shows a bright-field image of chromaffin cells 54 h after infection with CaMWT–pIRES–GFP adenovirus. Scale bar, 10 μm. Infected cells were identified by their EGFP fluorescence (middle). Dim cells (indicated by the arrow) were selected for electrophysiological experiments. Apoptosis was assessed with the DNA stain Hoechst 33342 (bottom). B, Correlation between EGFP expression levels and ICa density after adenoviral infection. Cells were infected with either EGFP adenovirus or CaMWT–pIRES–GFP adenovirus for 48 h. Tissue culture-matched uninfected cells (UIF) served as a control. EGFP fluorescence was measured and correlated to the size of the cell (brightness density in volts per picofarads). Accordingly, cells were categorized as dim (dark gray bars; <0.05 V/pF) or bright (light gray bars; >0.05 V/pF). Despite cell-to-cell variability, there is no significant difference overall in fluorescence measured between the dim EGFP and CaMWT group of cells. Thus, the mean ± SD fluorescence density for dim cells expressing EGFP was 0.016287 ± 0.00876 V/pF (range, 0.00462–0.037931 V/pF; n = 34) compared with 0.02207 ± 0.01017 V/pF (range, 0.00678–0.04286 V/pF; n = 26) for cells expressing CaMWT and EGFP. ICa density was calculated from the peak current evoked by a 10 ms pulse from a holding potential of −80 mV to a test potential of +20 mV divided by the cell size assessed from the whole-cell capacitance. Error bars represent mean ± SEM for number of cells indicated, **p < 0.01. C, Sample ICa evoked by a 200 ms depolarization from −80 to +20 mV in an uninfected and EGFP adenovirus-infected cell. I200/Ipeak was 55 ± 6%, n = 7 for control cells and 48 ± 7%, n = 4 for EGFP-expressing cells. D, Inactivation after repetitive depolarizations by a train of pulses (50 pulses for 10 ms at 20 Hz) was not significantly affected by adenovirus infection. Points represent the mean ± SEM fractional current measured in n = 7 uninfected cells and n = 4 culture-matched EGFP-infected cells.
Figure 5.
Figure 5.
CaM regulation of CDI in chromaffin cells. A, Western blot showing the overexpression of CaM and EGFP after viral infection of chromaffin cells with CaMWT or CaM1234 adenoviruses. Results from culture-matched uninfected cells are shown for comparison. B, Effect of replacing extracellular Ca2+ (■, ♦) with Ba2+ (□, ◇) on fractional ICa recorded during a train of 50 pulses of 10 ms duration from −80 to +20 mV, delivered at 20 Hz in cells infected with CaMWT (■, □) or CaM1234 (♦, ◇) adenoviruses. Data plotted are the mean ± SEM. CaMWT, n = 39 cells in Ca2+, n = 12 in Ba2+; CaM1234, n = 25 in Ca2+, n = 9 in Ba2+. C, Superimposed ICa activated with a 200 ms voltage steps from −80 to +20 mV before and after replacement of extracellular Ca2+ with Ba2+. Data shown are representative from an uninfected, CaMWT-infected, and CaM1234-infected cell. D, Current–voltage relationship for ICa in uninfected (▴), CaMWT-infected (■), or CaM1234-infected (♦) cells. ICa measured at each potential was normalized to the peak current, and data points represent the mean ± SEM from five cells in each group. Note that, in all three groups of cells, the threshold for activation of the channels is approximately −20 mV, consistent with them being high-voltage-gated channels of the CaV2 family. E, Steady-state inactivation properties were not affected by viral infection and expression of either CaMWT or CaM1234. ICa were elicited by a 50 ms test depolarization to +20 mV after a 30 s shift in the membrane holding potential to potentials varying from −80 to 60 mV. The peak ICa of the test pulse, normalized to the value obtained from a holding potential of −80 mV are plotted against membrane potential and fitted with a Boltzmann relationship. Mean ± SEM data are plotted from five cells from each group. V50 of −38 mV for CaMWT-infected, CaM1234-infected, and uninfected cells.
Figure 6.
Figure 6.
CaM regulates CDI in N-type but not P/Q-type channels in chromaffin cells. Inactivation of P/Q-type and N-type channels during a train of repetitive depolarizations from −80 to +20 mV, delivered at 20 Hz. A, Data plotted are the mean ± SEM for CaMWT-expressing (n = 5) and CaM1234-expressing (n = 6) cells and recorded with perforated patch and 1 μm ω-CgTx added to the external solution. B, Data are from CaMWT-expressing (n = 8) and CaM1234-expressing (n = 6) cells recorded in the presence of 300 nm AgaIVA. C, Schematic diagram showing the domains contained in the CaV2.1 RACE products isolated from bovine chromaffin cells. RIV, C′ terminal of domain IV including exon 36; EF, EF hand domain including exon 37; Bs, bovine-specific sequence; FLC, full-length C′ terminus; PIQ, pre-IQ domain; IQ, IQ-like domain. The sequence data and the corresponding nucleotide sequences are available from European Molecular Biology Laboratory/GenBank/DNA Data Bank of Japan under accession numbers AM421132, AM421133, AM421134, and AM421135 and in supplemental Figure 3B (available at www.jneurosci.org as supplemental material).
Figure 7.
Figure 7.
CDI of VGCCs in bovine chromaffin cells stimulated with a train of action potential-like waveforms. A, Schematic representation (top) of the action potential-like voltage protocol and superimposed representative currents recorded from a single chromaffin cell (bottom) recorded in the perforated-patch configuration before (control; black trace) and during application of the nonselective blocker of VGCCs, CdCl2 (100 μm; dashed gray trace). The stimulus train consisted of a 100 “action potentials” delivered at 100 Hz; currents shown correspond to the first two and last two evoked by a train. Note that CdCl2 blocks the second component of inward current consistent with it representing ICa, whereas the first component of current is insensitive to block as expected for current carried by voltage-gated Na channels. ap, Action potential. B, Superimposed currents from another representative cell before and after equimolar replacement of extracellular Ca2+ (black trace) with Ba2+ (dashed gray trace). Currents shown correspond to the first two and last two evoked by a train like that used in A. In Ba2+, currents do not decrease in amplitude over the course of the stimulus consistent with the abolition of CDI. C, Inactivation after repetitive depolarizations by a train of 100 action potentials (100 Hz) was significantly different between N-type (▿) and P/Q-type (▴) channels. Points represent the mean ± SEM fractional ICa measured in n = 4 cells under perforated-patch conditions. AP, Action potential.
Figure 8.
Figure 8.
CDI of N-type channels limits their ability to support exocytosis. A, Superimposed mean ICa (top) and corresponding Cm changes (bottom) recorded in chromaffin cells (n = 15) in response to 800 ms depolarizations. Gaps in the Cm traces indicate timing of depolarizing pulses during which capacitance detection was interrupted. The contribution from each channel subtype was assessed pharmacologically by addition of ω-CgTX (1 μm; n = 9) or AgaIVA (300 nm; n = 6). ΔCm were normalized to the maximum measured before addition of toxin. B, Mean Cm changes measured in cells stimulated with a train of 50 pulses of 10 ms duration from −80 to +20 mV delivered at 20 Hz (illustrated above the panel). Gaps in the Cm traces indicate timing of depolarizing pulses during which capacitance detection was interrupted. Superimposed traces show the contribution from N-type channels (dark gray trace) and P/Q-type channels (light gray trace) to the total secretory response (black trace; n = 6).

Similar articles

Cited by

References

    1. Alseikhan BA, DeMaria CD, Colecraft HM, Yue DT. Engineered calmodulins reveal the unexpected eminence of Ca2+ channel inactivation in controlling heart excitation. Proc Natl Acad Sci USA. 2002;99:17185–17190. - PMC - PubMed
    1. Altschul SF, Madden TL, Schäffer AA, Zhang J, Zhang Z, Miller W, Lipman DJ. Gapped BLAST and PSI-BLAST: a new generation of protein database search programs. Nucleic Acids Res. 1997;25:3389–3402. - PMC - PubMed
    1. Ashery U, Betz A, Xu T, Brose N, Rettig J. An efficient method for infection of adrenal chromaffin cells using the Semliki Forest virus gene expression system. Eur J Cell Biol. 1999;78:525–532. - PubMed
    1. Becherer U, Moser T, Stuhmer W, Oheim M. Calcium regulates exocytosis at the level of single vesicles. Nat Neurosci. 2003;6:846–853. - PubMed
    1. Bezprozvanny I, Scheller RH, Tsien RW. Functional impact of syntaxin on gating of N-type and Q-type calcium channels. Nature. 1995;378:623–626. - PubMed

Publication types

MeSH terms

LinkOut - more resources