Intrinsic disorder as a mechanism to optimize allosteric coupling in proteins
- PMID: 17494761
- PMCID: PMC1895946
- DOI: 10.1073/pnas.0700329104
Intrinsic disorder as a mechanism to optimize allosteric coupling in proteins
Abstract
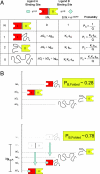
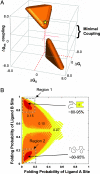
Transcription factors and other allosteric cell signaling proteins contain a disproportionate number of domains or segments that are intrinsically disordered (ID) under native conditions. In many cases folding of these segments is coupled to binding with one or more of their interaction partners, suggesting that intrinsic disorder plays an important functional role. Despite numerous hypotheses for the role of ID domains in regulation, a mechanistic model has yet to be established that can quantitatively assess the importance of intrinsic disorder for intramolecular site-to-site communication, the hallmark property of allosteric proteins. Here, we present such a model and show that site-to-site allosteric coupling is maximized when intrinsic disorder is present in the domains or segments containing one or both of the coupled binding sites. This result not only explains the prevalence of ID domains in regulatory proteins, it also calls into question the classical mechanical view of energy propagation in proteins, which predicts that site-to-site coupling would be maximized when a well defined pathway of folded structure connects the two sites. Furthermore, in showing that the coupling mechanism conferred by intrinsic disorder is robust and independent of the network of interactions that physically link the coupled sites, unique insights are gained into the energetic ground rules that govern site-to-site communication in all proteins.
Conflict of interest statement
The authors declare no conflict of interest.
Figures


Similar articles
-
Agonism/antagonism switching in allosteric ensembles.Proc Natl Acad Sci U S A. 2012 Mar 13;109(11):4134-9. doi: 10.1073/pnas.1120519109. Epub 2012 Mar 2. Proc Natl Acad Sci U S A. 2012. PMID: 22388747 Free PMC article.
-
Ensemble allosteric model: energetic frustration within the intrinsically disordered glucocorticoid receptor.Philos Trans R Soc Lond B Biol Sci. 2018 Jun 19;373(1749):20170175. doi: 10.1098/rstb.2017.0175. Philos Trans R Soc Lond B Biol Sci. 2018. PMID: 29735729 Free PMC article. Review.
-
Interplay between allostery and intrinsic disorder in an ensemble.Biochem Soc Trans. 2012 Oct;40(5):975-80. doi: 10.1042/BST20120163. Biochem Soc Trans. 2012. PMID: 22988850 Free PMC article. Review.
-
Modulation of allostery by protein intrinsic disorder.Nature. 2013 Jun 20;498(7454):390-4. doi: 10.1038/nature12294. Nature. 2013. PMID: 23783631 Free PMC article.
-
Intrinsic disorder in scaffold proteins: getting more from less.Prog Biophys Mol Biol. 2008 Sep;98(1):85-106. doi: 10.1016/j.pbiomolbio.2008.05.007. Epub 2008 Jun 20. Prog Biophys Mol Biol. 2008. PMID: 18619997 Free PMC article. Review.
Cited by
-
Negative coupling as a mechanism for signal propagation between C2 domains of synaptotagmin I.PLoS One. 2012;7(10):e46748. doi: 10.1371/journal.pone.0046748. Epub 2012 Oct 5. PLoS One. 2012. PMID: 23071627 Free PMC article.
-
Effect of magnitude and variability of energy of activation in multisite ultrasensitive biochemical processes.PLoS Comput Biol. 2020 Aug 6;16(8):e1007966. doi: 10.1371/journal.pcbi.1007966. eCollection 2020 Aug. PLoS Comput Biol. 2020. PMID: 32760072 Free PMC article.
-
Allostery in the dynamic coactivator domain KIX occurs through minor conformational micro-states.PLoS Comput Biol. 2022 Apr 22;18(4):e1009977. doi: 10.1371/journal.pcbi.1009977. eCollection 2022 Apr. PLoS Comput Biol. 2022. PMID: 35452454 Free PMC article.
-
Expanding the Paradigm: Intrinsically Disordered Proteins and Allosteric Regulation.J Mol Biol. 2018 Aug 3;430(16):2309-2320. doi: 10.1016/j.jmb.2018.04.003. Epub 2018 Apr 7. J Mol Biol. 2018. PMID: 29634920 Free PMC article. Review.
-
Electrostatically accelerated encounter and folding for facile recognition of intrinsically disordered proteins.PLoS Comput Biol. 2013;9(11):e1003363. doi: 10.1371/journal.pcbi.1003363. Epub 2013 Nov 21. PLoS Comput Biol. 2013. PMID: 24278008 Free PMC article.
References
Publication types
MeSH terms
Substances
Grants and funding
LinkOut - more resources
Full Text Sources
Other Literature Sources

