. 2007 May 15;104(20):8207-11.
doi: 10.1073/pnas.0611085104. Epub 2007 May 9.

Single-molecule mass spectrometry in solution using a solitary nanopore

Affiliations

Single-molecule mass spectrometry in solution using a solitary nanopore

Joseph W F Robertson et al. Proc Natl Acad Sci U S A. .

Abstract

We introduce a two-dimensional method for mass spectrometry in solution that is based on the interaction between a nanometer-scale pore and analytes. As an example, poly(ethylene glycol) molecules that enter a single alpha-hemolysin pore cause distinct mass-dependent conductance states with characteristic mean residence times. The conductance-based mass spectrum clearly resolves the repeat unit of ethylene glycol, and the mean residence time increases monotonically with the poly(ethylene glycol) mass. This technique could prove useful for the real-time characterization of molecules in solution.


Conflict of interest statement

The authors declare no conflict of interest.

Figures
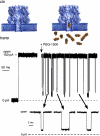
Fig. 1.
Fig. 1.
Neutral polymers cause well defined reductions in the ionic current as they partition into a solitary nanopore in a lipid bilayer membrane. (Middle Left) The ionic current, through an αHL channel bathed by a polymer-free solution, is quiescent. Addition of polydisperse PEG (Mr = 1,500 g/mol) (Top Right) cause persistent current blockades (Middle Right and Bottom). The solutions bathing the membrane contained 4 M KCl and 5 mM Tris buffer, pH 7.5. (Middle and Bottom) The horizontal dashed lines indicate zero current.
Fig. 2.
Fig. 2.
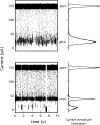
A single nanopore discriminates between polymers with different molecular masses. The difference between the conductance states caused by polydisperse (Mr = 1,500) (Lower Left) and monodisperse (M = 1,294 g/mol, n = 29) (Upper Left) PEG is readily apparent. The time series data shown contained ∼500 and ∼700 events for the poly- and monodisperse PEG samples, respectively. (Upper and Lower Right) All-points histograms of the ionic current reflect the distinct natures of the two polymer samples. The ionic current histograms for each sample were calculated from >105 blockade events. The long-lived, small ionic current blockades near zero in the monodisperse PEG time series are most likely caused by impurities in the PEG samples. These events are long-lived but few in number.
Fig. 3.
Fig. 3.
Mass distributions obtained with a single nanopore (Upper) is compared with a conventional MALDI-TOF mass spectrum (Lower) for polydisperse PEG (Mr = 1,500 g/mol). The histogram was obtained as described in the text. Greater values of I/Iopen correspond to lower PEG molecular masses. The histogram of the state-averaged current (red) are overlaid with the GMM fit (black). The model fits the empirical probability density function well with a Kolmogorov–Smirnov goodness of fit statistic, KS = 0.295 (32). The mean conductance-based histogram for monodisperse PEG-1294 (blue) is scaled to the height of the corresponding polydisperse peak. In the MALDI-MS, under the desorption/ionization conditions used, each PEG n-mer yields a parent ion peak, MH+, and a base peak 16–17 units lower in mass, suggesting a loss of −O or −OH.
Fig. 4.
Fig. 4.
The current through a solitary nanopore discriminates between individual PEG polymers that have different molecular masses. Ionic current blockades caused by individual molecules are assigned to Gaussian states of the nanopore mass spectrogram (Fig. 3 Upper). The GMM permits assignment of individual blockades to the conductance states by maximum likelihood decoding (solid black lines). (Upper) A 15-second-long block of data showing the open channel and blockade states. Expansion of the time series data in the highlighted region (Lower Left) compared with a histogram made from the GMM fit (Lower Right). The colored peaks in the histogram reference the individual polymers in the pPEG that are discussed in Fig. 5.
Fig. 5.
Fig. 5.
Residence-time distributions associated with each polymer species vary systematically with the polymer mass. The derived residence time distributions are shown on a semilog plot for three representative states corresponding to the 1,294 (red), 1,558 (green), and 2,042 (blue) g/mol components of pPEG and to mPEG 1294 (black). The mean residence times, estimated from a least-squares fit of a single exponential to each data set are (in milliseconds) as follows: (2.8 ± 0.1), (3.2 ± 0.1), (13.4 ± 0.1), (52 ± 2) for mPEG 1294, pPEG 1294, pPEG 1558, and pPEG 2042, respectively.

Similar articles

Cited by

References

    1. Coulter WH. US Patent. 2,656,508. 1953.
    1. Ito T, Sun L, Crooks RM. Anal Chem. 2003;75:2399–2406. - PubMed
    1. Saleh OA, Sohn LL. Nano Lett. 2003;3:37–38.
    1. Heins EA, Siwy ZS, Baker LA, Martin CR. Nano Lett. 2005;5:1824–1829. - PubMed
    1. Song LZ, Hobaugh MR, Shustak C, Cheley S, Bayley H, Gouaux JE. Science. 1996;274:1859–1866. - PubMed

Publication types

MeSH terms