. 2007 Jul 1;582(Pt 1):297-315.
doi: 10.1113/jphysiol.2007.131540. Epub 2007 May 10.

Changes in firing pattern of lateral geniculate neurons caused by membrane potential dependent modulation of retinal input through NMDA receptors

Affiliations

Changes in firing pattern of lateral geniculate neurons caused by membrane potential dependent modulation of retinal input through NMDA receptors

S Augustinaite et al. J Physiol. .

Abstract

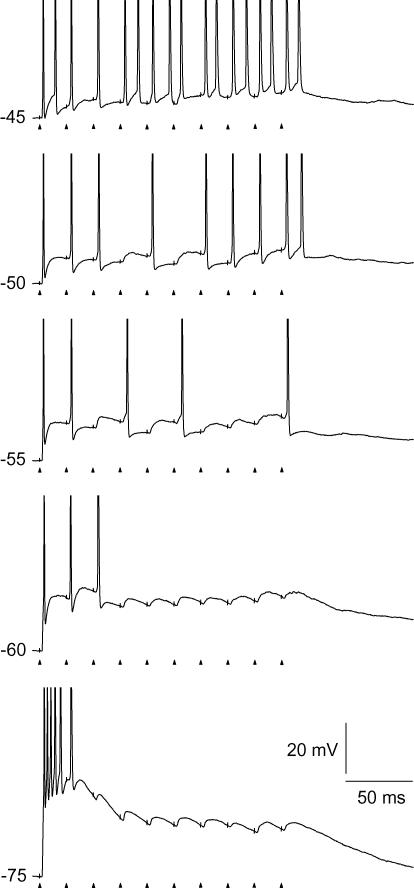
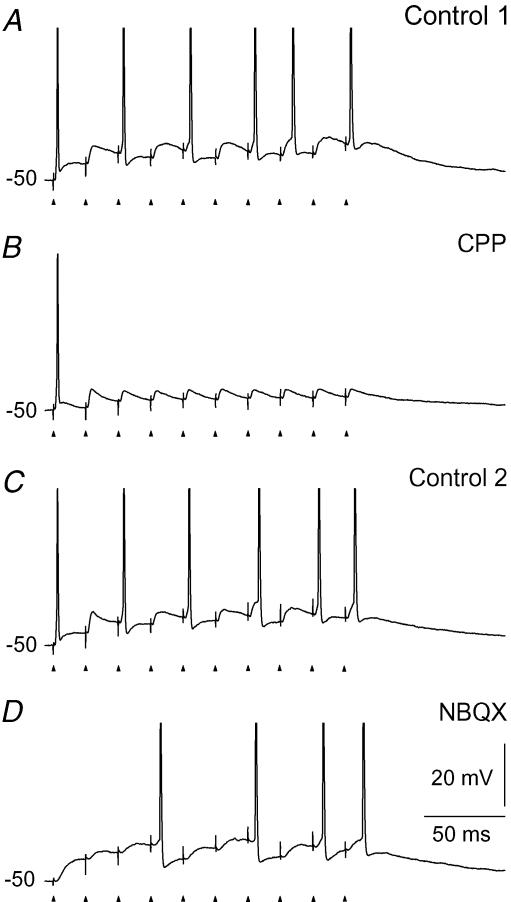
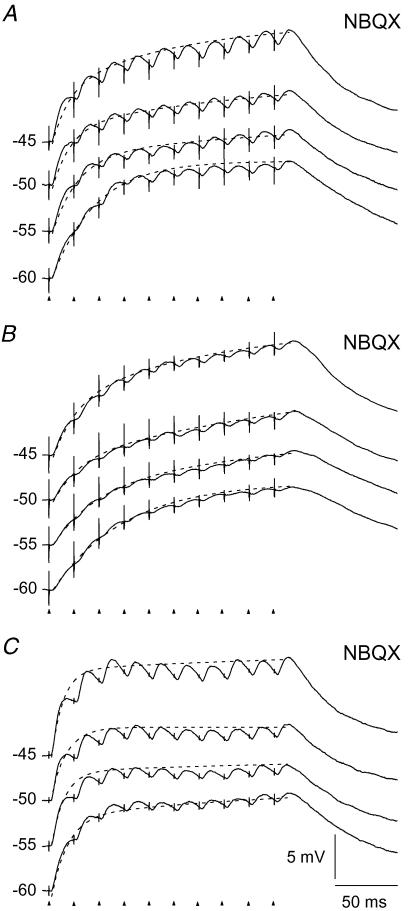
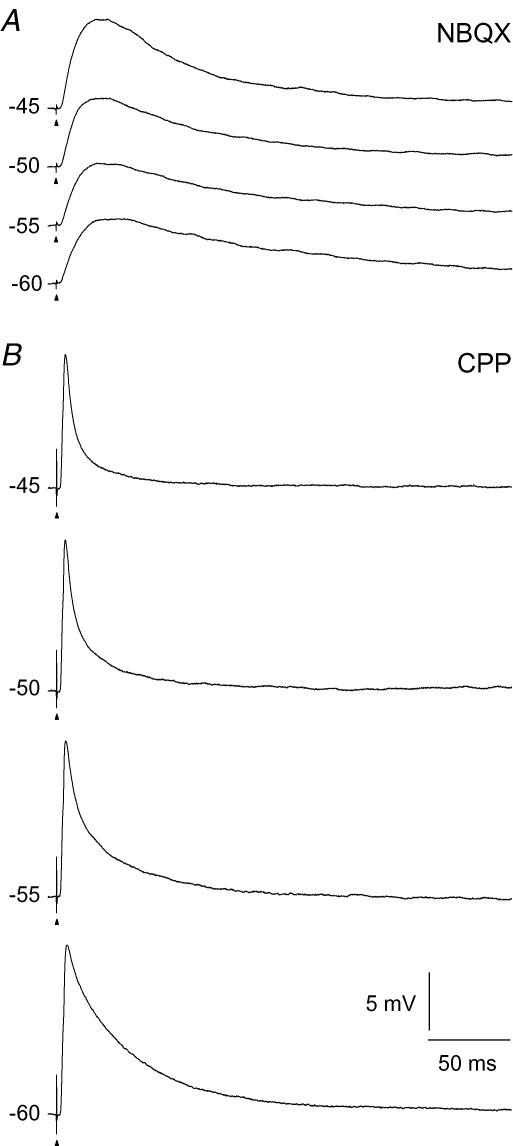
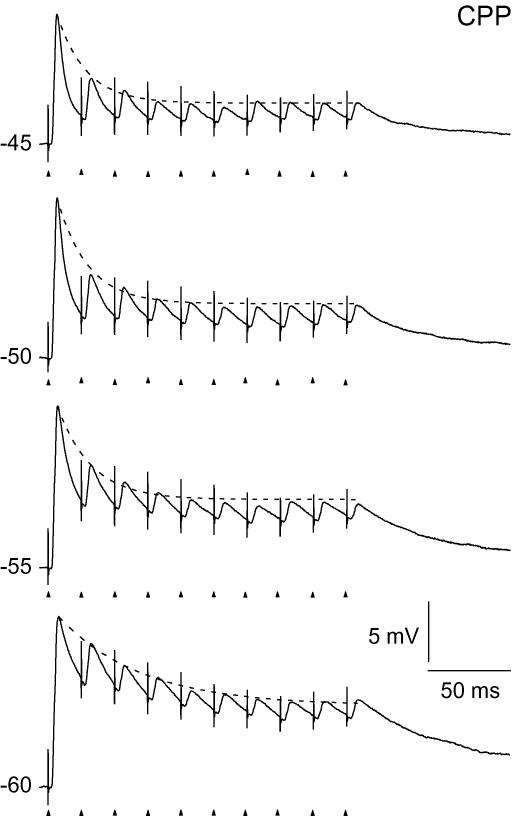
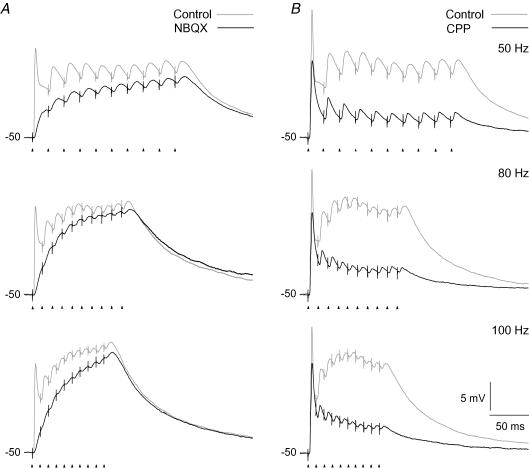
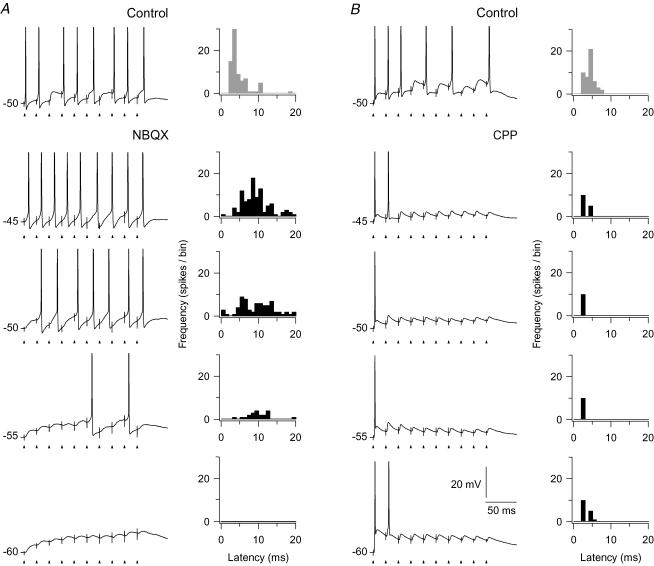
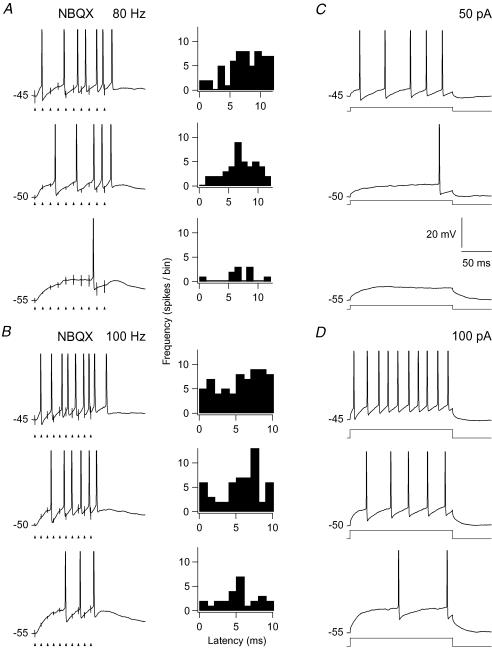
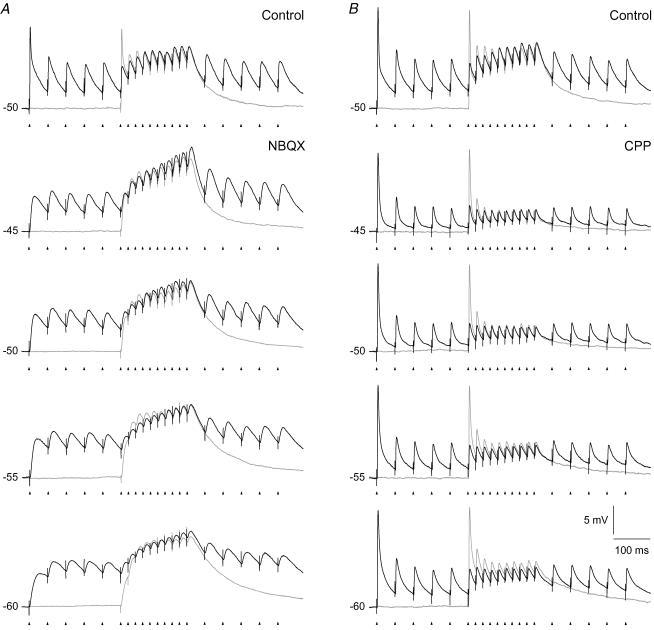
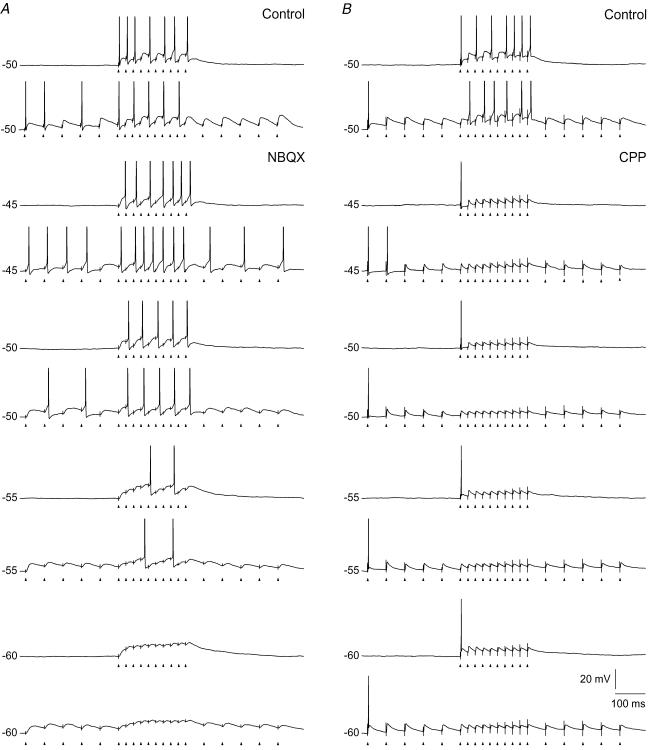
An optimal visual stimulus flashed on the receptive field of a retinal ganglion cell typically evokes a strong transient response followed by weaker sustained firing. Thalamocortical (TC) neurons in the dorsal lateral geniculate nucleus, which receive their sensory input from retina, respond similarly except that the gain, in particular of the sustained component, changes with level of arousal. Several lines of evidence suggest that retinal input to TC neurons through NMDA receptors plays a key role in generation of the sustained response, but the mechanisms for the state-dependent variation in this component are unclear. We used a slice preparation to study responses of TC neurons evoked by trains of electrical pulses to the retinal afferents at frequencies in the range of visual responses in vivo. Despite synaptic depression, the pharmacologically isolated NMDA component gave a pronounced build-up of depolarization through temporal summation of the NMDA receptor mediated EPSPs. This depolarization could provide sustained firing, the frequency of which depended on the holding potential. We suggest that the variation of sustained response in vivo is caused mainly by the state-dependent modulation of the membrane potential of TC neurons which shifts the NMDA receptor mediated depolarization closer to or further away from the firing threshold. The pharmacologically isolated AMPA receptor EPSPs were rather ineffective in spike generation. However, together with the depolarization evoked by the NMDA component, the AMPA component contributed significantly to spike generation, and was necessary for the precise timing of the generated spikes.


Figures

Figure 1
Figure 1. Firing patterns of a TC neuron at different holding potentials evoked by pulse train stimulation of retinal afferents
The frequency of the pulse train was 50 Hz. Holding potentials are indicated to the left of the trace. Timing of stimulus pulses is indicated by arrow-heads below the traces, and can also be deduced from the stimulation artefacts on the traces (truncated). Spike amplitudes were truncated at 0 mV.
Figure 2
Figure 2. Contributions of AMPA and NMDA components to the firing patterns evoked by stimulation of retinal afferents
The frequency of the pulse train was 50 Hz. A, response in the control condition before application of the NMDA receptor antagonist CPP. B, firing pattern mediated by the AMPA component after application of 10 μm CPP through the perfusion solution. C, response after wash-out of CPP. D, firing pattern mediated by the NMDA component after blockade of the AMPA-Rs by 10 μm NBQX.
Figure 3
Figure 3. Temporal summation of NMDA-R and AMPA-R mediated EPSPs evoked at different holding potentials
Responses to 50 Hz pulse train stimulation of retinal afferents. A, temporal summation of NMDA-R mediated EPSPs. Traces in grey, responses in the control condition before blockade of AMPA-Rs. Traces in black, responses after blockade of AMPA-Rs with 10 μm NBQX. B, temporal summation of AMPA-R mediated EPSPs. Traces in grey, responses in the control condition before blockade of NMDA-Rs. Traces in black, responses after blockade of NMDA-Rs with 10 μm CPP. Voltage dependent sodium spikes were blocked by QX222 added to the intracellular solution. Each trace is the average of five repetitive train stimulations. Data in A and B are from two different cells.
Figure 4
Figure 4. Variation between neurons in rise time and degree of accumulated depolarization during temporal summation of NMDA-R mediated EPSPs
Responses to pulse train stimulation (50 Hz) of retinal afferents. A–C, results from three different neurons showing temporal summation of EPSPs mediated by NMDA-Rs. AMPA-Rs were blocked by 10 μm NBQX. The traces are averages of 5 stimulus repetitions. Dashed curves are double exponentials fitted to the peak EPSP after each stimulus pulse.
Figure 5
Figure 5. Single-pulse EPSPs evoked at different holding potentials
A, NMDA-R mediated EPSPs. AMPA-Rs were blocked by 10 μm NBQX. B, AMPA-R mediated EPSPs. NMDA-Rs were blocked by 15 μm CPP. Each trace is an average of 5 responses. The data in A and B are from two different cells.
Figure 6
Figure 6. Temporal summation of AMPA-R mediated EPSPs at different holding potentials evoked by stimulation of retinal afferents
Responses to 50 Hz pulse train stimulation during blockade of NMDA-Rs with 15 μm CPP. Averages of 5 repetitions of stimulation. Dashed lines, single exponential functions fitted to EPSP peaks.
Figure 7
Figure 7. Temporal summation of evoked EPSPs at different pulse train frequencies
Responses to three different frequencies of pulse train stimulation at a holding potential of −50 mV. A, results for the NMDA component. Grey traces, responses in the control condition before wash-in of AMPA-R antagonist. Black traces, responses after application of 10 μm NBQX. B, results for the AMPA component. Grey traces, responses in control condition before wash-in of NMDA-R antagonist. Black traces, responses after application of 15 μm CPP. Data in A and B are from two different cells. Each trace is an average of 5 responses.
Figure 8
Figure 8. Spike-firing pattern and spike timing to train stimulation of retinal afferents at different holding potentials
Each trace is from single train stimulation at 50 Hz. A, left, results for the NMDA component. Upper trace, response in the control condition before application of the AMPA-R antagonist. The other traces were recorded after blockade of AMPA-Rs with 10 μm NBQX. Right, histograms showing the distribution of latencies of the spikes, in the respective conditions, calculated from the closest preceding pulse in the train stimulus. Each histogram is based on spikes from 10 repetitions of the train stimulation. Bin width, 1 ms. The uppermost histogram (with grey bars) is for the control condition. B, left, results for the AMPA component. Uppermost trace, for the control condition before application of antagonist. The other traces, after wash-in of 15 μm CPP. Right, histograms of spike latencies for spikes from 10 train stimulations, as in A.
Figure 9
Figure 9. Similarities between NMDA-R mediated responses to pulse-train stimulation and responses to a current step
A, left, firing pattern evoked at three different holding potentials by pulse train stimulation of retinal afferents at 80 Hz during application of 10 μm NBQX. Right, corresponding distribution of spike latencies, as in Fig. 8. B, similar results as in A except for train stimulation at 100 Hz. C, firing pattern evoked by a depolarizing current step (50 pA) delivered at the same three holding potentials as in A. D, firing pattern evoked by a depolarizing current step (100 pA) at the same three holding potentials as in A.
Figure 10
Figure 10. Influence of immediately preceding synaptic input on the EPSP amplitudes evoked by pulse train stimulation at different holding potentials
Comparison of responses to two different patterns of pulse train stimulation of retinal afferents. Black traces, responses to a three-part stimulus train with the first part consisting of 5 pulses at 20 Hz, the second part with 10 pulses at 50 Hz, and the third part with 5 pulses at 20 Hz. Grey traces, control recordings of responses to the 50 Hz train stimulus alone. A, responses of the NMDA component. Top panel, control before wash-in of AMPA-R antagonist. Lower panels, traces at different membrane potentials after blockade of AMPA-Rs with 10 μm NBQX. B, responses of the AMPA component. Top panel, control before wash-in of NMDA-R antagonist. Lower panels, traces after blockade of NMDA-Rs with 15 μm CPP. Each trace is an average of 5 responses. The data in A and B are from two different cells.
Figure 11
Figure 11. Influence of immediately preceding synaptic input on spike patterns evoked by pulse train stimulation at different holding potentials
Comparison of responses to the same two patterns of pulse train stimulation of retinal afferents as in Fig. 10. For each holding potential there is a pair of traces; the upper trace is response to the 50 Hz train in the control condition without preceding synaptic input; the lower trace is response in the condition with 5 pulses at 20 Hz preceding and following the 50 Hz train. A, responses of the NMDA component. Top pair of panels, control before wash-in of AMPA-R antagonist. Lower pairs of panels, traces at different membrane potentials after blockade of AMPA-Rs with 10 μm NBQX. B, responses for the AMPA component. Top pair of panels, control before wash-in of NMDA-R antagonist. Lower pairs of panels, traces after blockade of NMDA-Rs with 15 μm CPP. The data in A and B are from two different cells.

References

    1. Balkema GW, Pinto LH. Electrophysiology of retinal ganglion cells in the mouse: a study of a normally pigmented mouse and a congenic hypopigmentation mutant, pearl. J Neurophysiol. 1982;48:968–980. - PubMed
    1. Blitz DM, Regehr WG. Retinogeniculate synaptic properties controlling spike number and timing in relay neurons. J Neurophysiol. 2003;90:2438–2450. - PubMed
    1. Blitz DM, Regehr WG. Timing and specificity of feed-forward inhibition within the LGN. Neuron. 2005;45:917–928. - PubMed
    1. Chen CF, Blitz DM, Regehr WG. Contributions of receptor desensitization and saturation to plasticity at the retinogeniculate synapse. Neuron. 2002;33:779–788. - PubMed
    1. Coenen AML, Vendrik AJH. Determination of the transfer ratio of cat's geniculate neurons through quasi-intracellular recordings and the relation with the level of alertness. Exp Brain Res. 1972;14:227–242. - PubMed

Publication types

MeSH terms

Substances

LinkOut - more resources