

Sweet taste receptors in rat small intestine stimulate glucose absorption through apical GLUT2
- PMID: 17495045
- PMCID: PMC2075289
- DOI: 10.1113/jphysiol.2007.130906
Sweet taste receptors in rat small intestine stimulate glucose absorption through apical GLUT2
Erratum in
- J Physiol. 2007 Aug 15;583(Pt 1):411
Abstract
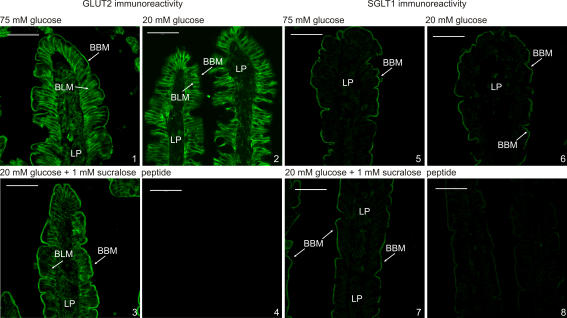
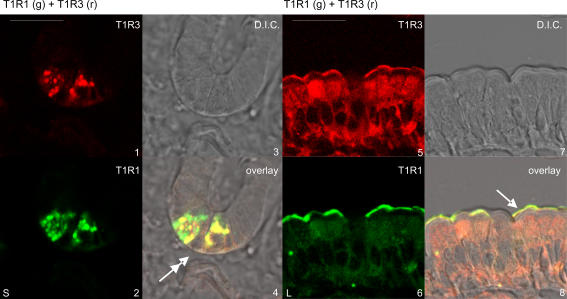
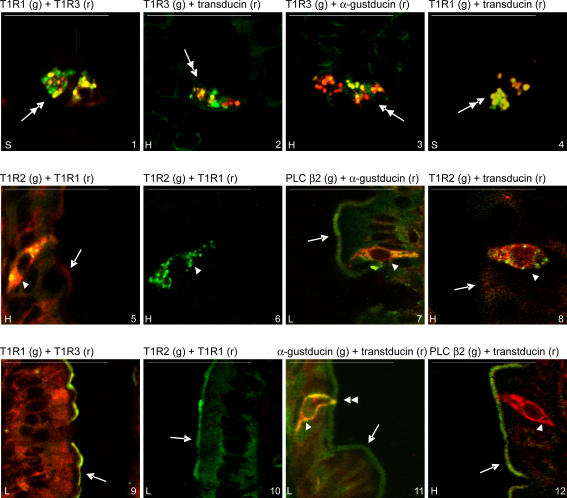
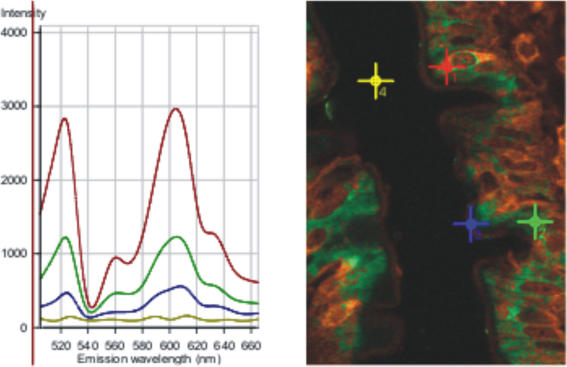
Natural sugars and artificial sweeteners are sensed by receptors in taste buds. T2R bitter and T1R sweet taste receptors are coupled through G-proteins, alpha-gustducin and transducin, to activate phospholipase C beta2 and increase intracellular calcium concentration. Intestinal brush cells or solitary chemosensory cells (SCCs) have a structure similar to lingual taste cells and strongly express alpha-gustducin. It has therefore been suggested over the last decade that brush cells may participate in sugar sensing by a mechanism analogous to that in taste buds. We provide here functional evidence for an intestinal sensing system based on lingual taste receptors. Western blotting and immunocytochemistry revealed that all T1R members are expressed in rat jejunum at strategic locations including Paneth cells, SCCs or the apical membrane of enterocytes; T1Rs are colocalized with each other and with alpha-gustducin, transducin or phospholipase C beta2 to different extents. Intestinal glucose absorption consists of two components: one is classical active Na+-glucose cotransport, the other is the diffusive apical GLUT2 pathway. Artificial sweeteners increase glucose absorption in the order acesulfame potassium approximately sucralose > saccharin, in parallel with their ability to increase intracellular calcium concentration. Stimulation occurs within minutes by an increase in apical GLUT2, which correlates with reciprocal regulation of T1R2, T1R3 and alpha-gustducin versus T1R1, transducin and phospholipase C beta2. Our observation that artificial sweeteners are nutritionally active, because they can signal to a functional taste reception system to increase sugar absorption during a meal, has wide implications for nutrient sensing and nutrition in the treatment of obesity and diabetes.
Figures
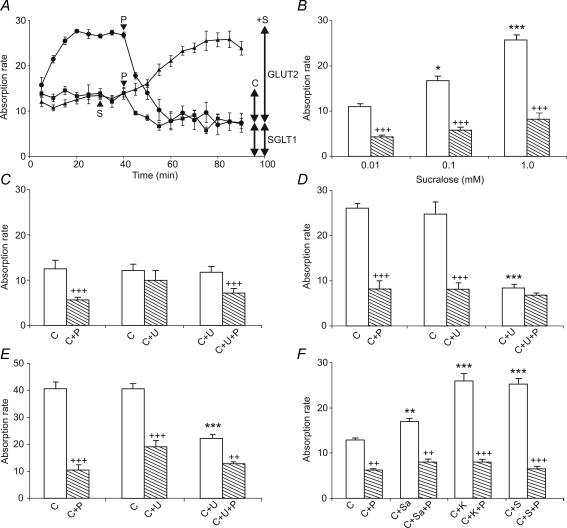
 , 0–40 min) and presence (
 , 40–80 min) of 1 m
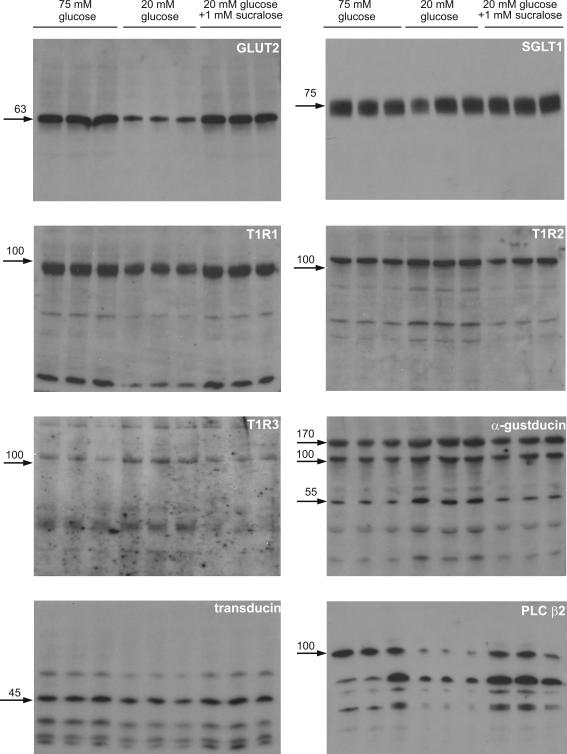
References
-
- Adler E, Hoon MA, Mueller KL, Chandrashekar J, Ryba NJ, Zuker CS. A novel family of mammalian taste receptors. Cell. 2000;100:693–702. - PubMed
-
- Ahonen A, Penttila A. Effects of fasting and feeding and pilocarpine on paneth cells of the mouse. Scand J Gastroenterol. 1975;10:347–352. - PubMed
-
- Baba R, Yamami M, Sakuma Y, Fujita M, Fujimoto S. Relationship between glucose transporter and changes in the absorptive system in small intestinal absorptive cells during the weaning process. Med Mol Morphol. 2005;38:47–53. - PubMed
Publication types
MeSH terms
Substances
Grants and funding
LinkOut - more resources
Full Text Sources
Other Literature Sources
Medical
Molecular Biology Databases