Clinical Trial
. 2007 Sep 1;110(5):1429-38.
doi: 10.1182/blood-2006-12-059790. Epub 2007 May 10.

Identification of genomic classifiers that distinguish induction failure in T-lineage acute lymphoblastic leukemia: a report from the Children's Oncology Group

Affiliations
Clinical Trial

Identification of genomic classifiers that distinguish induction failure in T-lineage acute lymphoblastic leukemia: a report from the Children's Oncology Group

Stuart S Winter et al. Blood. .

Erratum in

  • Blood. 2008 May 1;111(9):4830

Abstract

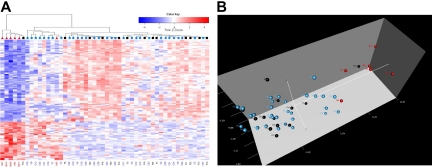
The clinical and cytogenetic features associated with T-cell acute lymphoblastic leukemia (T-ALL) are not predictive of early treatment failure. Based on the hypothesis that microarrays might identify patients who fail therapy, we used the Affymetrix U133 Plus 2.0 chip and prediction analysis of microarrays (PAM) to profile 50 newly diagnosed patients who were treated in the Children's Oncology Group (COG) T-ALL Study 9404. We identified a 116-member genomic classifier that could accurately distinguish all 6 induction failure (IF) cases from 44 patients who achieved remission; network analyses suggest a prominent role for genes mediating cellular quiescence. Seven genes were similarly upregulated in both the genomic classifier for IF patients and T-ALL cell lines having acquired resistance to neoplastic agents, identifying potential target genes for further study in drug resistance. We tested whether our classifier could predict IF within 42 patient samples obtained from COG 8704 and, using PAM to define a smaller classifier for the U133A chip, correctly identified the single IF case and patients with persistently circulating blasts. Genetic profiling may identify T-ALL patients who are likely to fail induction and for whom alternate treatment strategies might be beneficial.


Figures

Figure 1
Figure 1
Identification of a genomic classifier for induction failure among 50 T-ALL samples. PAM cross-validation was used to identify genes that could distinguish patients who failed induction (⋯) from those who maintained a CCR for more than 4 years (—) and from those who relapsed after achieving remission (- -). A centroid level of 0 corresponds to 54 675 genes, ESTs, and probe sets, while a centroid level of 4.95 corresponds to 1 gene; the vertical bars indicate near-stable CV error rates between shrunken centroid threshold Δ values of 3.00 to 4.00. Asterisk indicates most efficient classifier.
Figure 2
Figure 2
Cluster identification of patients for whom induction has failed in T-ALL. (A) Hierarchic clustering of samples (columns) and genes (rows) shows differential expression for patients in the IF (red triangle), RE (black square), and CCR (blue circle) cohorts. Red cells indicate high expression, and blue cells indicate low expression. (B) In 3-dimensional principal component analysis (PCA), 50 T-ALL samples were projected in the feature space based on differential expression for 116 probes. Each sphere represents a sample: red spheres denote IF patients, black spheres indicate RE postinduction remission, and blue spheres show patients who have remained in CCR for longer than 4 years. In panels A and B, the patients for whom induction failed clustered together, indicating a unique and shared genetic signature.
Figure 3
Figure 3
Network analysis of genetic pathways active in the IF cohort shows a checkpoint arrest at G1/S transition. To identify biologic function and interactions in the differentially expressed genes in the 116-member genomic classifier, we used Ingenuity Systems software to map gene networks and identifying potentially dysregulated pathways in the IF T-ALL cohort. Network analysis shows that TGFβ1, LYN, and LATS2 interact with and down-regulate CDC2 and CDC25 to result in a arrest of cell cycle progression at the G1/S checkpoint. Absent from this network analysis are genes governing drug metabolism (p450 enzymes) or apoptotic pathways. Each gene node represents a functional class, for which an upward-pointing triangle indicates a phosphatase, a downward-pointing triangle indicates a kinase, a vertical rectangle indicates a G-protein–coupled receptor, a square indicates a cytokine, and a circle indicates genes having other functions, to include surface receptors and adhesive ligands. Nodes that are colored in red indicate relative up-regulation, and nodes in green indicate relative down-regulation.
Figure 4
Figure 4
Intersection union testing of genes up-regulated between IF patients and drug-resistant cell lines. (A) Differential expression between IF patients and drug-resistant cell lines identified 7 up-regulated genes. (B) Box-plot distributions for 8 up-regulated genomic classifiers, including 2 probes for LATS2: (i) 207761_s_at (DKFZ P586AD522), (ii) 216203_at (SPLTC2), (iii) 218618_s_at (FAD104), (iv) 218847_at (IMP-2), (v) 223380_s_at (LATS2), (vi) 226550_at (FLJ39602), (vii) 227013_at (LATS2), and (viii) 235824_at (EST). These data show differential expression in genes with shared upregulation in the IF cohort, compared with the RE and CCR subsets. Boxes indicate the range of data for each data set; vertical bars with horizontal lines represent the error bars associated with each data set.

References

    1. Amylon MD, Shuster J, Pullen J, et al. Intensive high-dose asparaginase consolidation improves survival for pediatric patients with T cell acute lymphoblastic leukemia and advanced stage lymphoblastic lymphoma: a Pediatric Oncology Group study. Leukemia. 1999;13:335–342. - PubMed
    1. Pullen J, Shuster JJ, Link MP, et al. Significance of commonly used prognostic factors differs for children with T-cell acute lymphoblastic leukemia (ALL) compared with those with B-precursor ALL: a Pediatric Oncology Group Study. Leukemia. 1999;13:1696–1707. - PubMed
    1. Uckun FM, Sensel MG, Sun L, et al. Biology and treatment of childhood T-Lineage acute lymphoblastic leukemia. Blood. 1998;91:735–746. - PubMed
    1. Shuster JJ, Falletta JM, Pullen DJ, et al. Prognostic factors in childhood T-cell acute lymphoblastic leukemia: a Pediatric Oncology Group Study. Blood. 1990;75:166–173. - PubMed
    1. Winick NJ, Carroll WL, Hunger SP. Childhood leukemia: new advances and challenges. N Engl J Med. 2004;351:601–603. - PubMed

Publication types

MeSH terms