

doi: 10.1126/science.1140881.
Regulation of B versus T lymphoid lineage fate decision by the proto-oncogene LRF
Affiliations
- PMID: 17495164
- PMCID: PMC2978506
- DOI: 10.1126/science.1140881
Item in Clipboard
Regulation of B versus T lymphoid lineage fate decision by the proto-oncogene LRF
Science.
.
Abstract
Hematopoietic stem cells in the bone marrow give rise to lymphoid progenitors, which subsequently differentiate into B and T lymphocytes. Here we show that the proto-oncogene LRF plays an essential role in the B versus T lymphoid cell-fate decision. We demonstrate that LRF is key for instructing early lymphoid progenitors in mice to develop into B lineage cells by repressing T cell-instructive signals produced by the cell-fate signal protein, Notch. We propose a new model for lymphoid lineage commitment, in which LRF acts as a master regulator of the cell's determination of B versus T lineage.
Figures
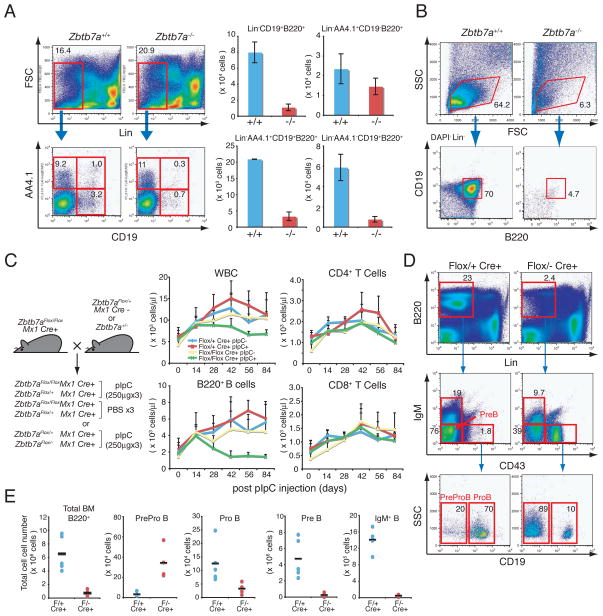
LRF is indispensable for both fetal and adult B lymphopoiesis. (A) 14.5 d.p.c FL cells were stained with fluorochrome-conjugated anti-B220, CD19, AA4.1 and lineage markers. Representative FACS profiles of the Zbtb7a+/+ and Zbtb7a−/− FL cells are shown (left). Total numbers of FL mononuclear cells were counted and absolute number of B cells in each developmental stage was calculated. Average cell numbers of three independent embryos for each genotype are presented with +/− standard deviations (SD). (B) The 14.5 d.p.c. FL-HSCs (Lin−Sca1+c-Kit+) were cultured on OP9 stromal cell layers in the presence of IL-7 and Flt3 ligand. After 10 days of culture, cells were isolated and analyzed by FACS. (C) Schematic representations of mouse breeding strategy for conditional LRF knockout experiments (left). Follow-up of the PB counts after pIpC (or PBS) injections overtime (right). 4 groups of mice were examined according to genotype and treatment. WBC counts in the PB were measured by a hematology analyzer and total numbers of B and T cells were subsequently calculated based on the percent positivity of B220 and CD4/8 expression, respectively. The average cell count of 5 animals was plotted on each time point with error bars (+/− SD). (D) BM cells were stained with fluorochrome-conjugated anti-B220, CD19, IgM, CD43 and lineage markers (21) one month after the last pIpC injection. Representative FACS profiles for each genotype are demonstrated. (E) Absolute cell number of each population was calculated according to FACS profiles. Black horizontal bars represent mean cell counts among 5 animals.
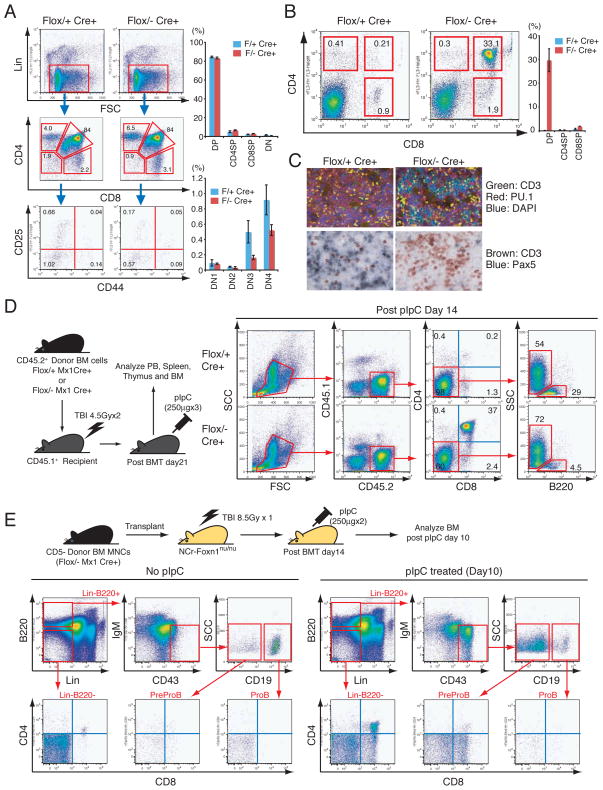
Extrathymic DP-T cell development in the BM upon LRF loss. (A) Thymic T cells were analyzed one month after pIpC injection. Representative FACS profiles for each genotype are shown (left). Proportions of CD4/8 double negative (DN), CD4/8 double positive (DP), CD4 single positive (CD4SP) and CD8 single positive (CD8SP) populations were examined and the DN fraction was further stratified according to CD44 and CD25 expression. Three mice were analyzed for each genotype (right). (B) BMMNCs were analyzed for CD4/8 expression one month after pIpC treatment. Representative FACS profiles for each genotype are shown (left). Average percent positivity of three mice for each genotype is demonstrated with +/− SD (right). (C) Immunofluorescent analysis of CD3 and PU.1 expression in BM sections (top). Immunohistochemical analysis of T cell and B cell markers (CD3 and Pax5, respectively) in BM sections one month after pIpC treatment (bottom). (D) Either Zbtb7aFlox/+ Mx1cre+ or Zbtb7aFlox/− Mx1cre+ donor BMMNCs (CD45.2+) were transplanted into lethally irradiated recipient mice (CD45.1+). Upon engraftment, recipient mice were treated with pIpC. Recipients’ BMMNCs were then collected and analyzed two weeks after the last pIpC administration. Representative FACS profiles are presented. (E) Zbtb7aFlox/− Mx1cre+ donor BMMNCs (CD45.2+) were transplanted into lethally irradiated recipient nude mice. Two weeks after transplantation, mice were treated with either pIpC or PBS. Recipients’ BMMNCs were harvested and subsequently analyzed 10 days after the last pIpC administration. Representative BM FACS profiles are presented.
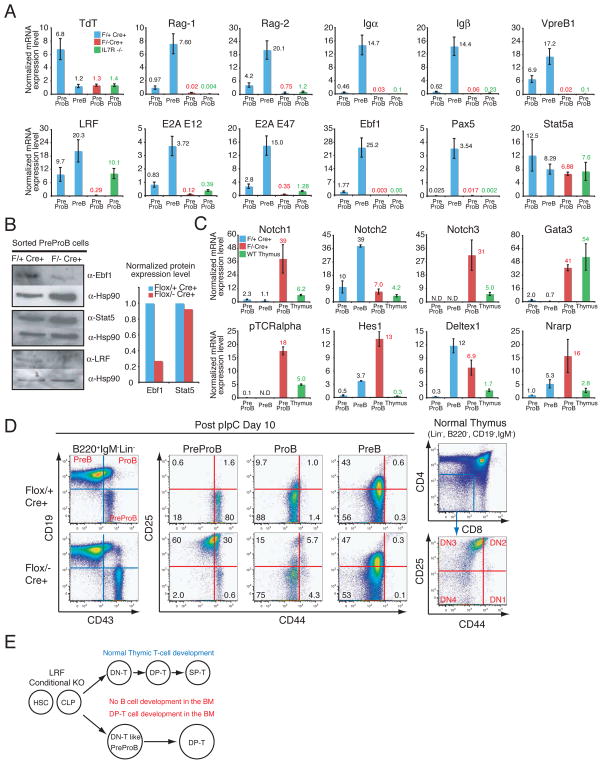
pIpC-treated Zbtb7aFlox/− Mx1cre+ PreProB cells are defective in early B cell development and demonstrate a DN-T cell signature. (A) q-RT-PCR analysis of the genes encoding pre-BCR components, TdT, the Rag recombinases and the critical transcription factors in early B cell development. mRNA expression levels were normalized to Hprt mRNA amount and are represented by bar graphs. Each sample was analyzed in duplicate and error bars indicate +/− SD. BMMNCs were collected and flow-sorted one month after the last pIpC injection. (B) Western blot analysis for Ebf1 and Stat5 protein in the pIpC-treated PreProB cells. Bar graph represents normalized protein expression level over corresponding Hsp90 protein level. (C) q-RT-PCR analysis of Notch and Notch target genes in the PreProB cells. q-RT-PCR was performed as described in (A). (D) CD25 and CD44 expression in PreProB cells was examined 10 days after the last pIpC injection. FACS profiles of normal thymic DN-T cell populations are also presented. (E) Schematic representation of lymphoid lineage development in LRF conditional knockout mutants.
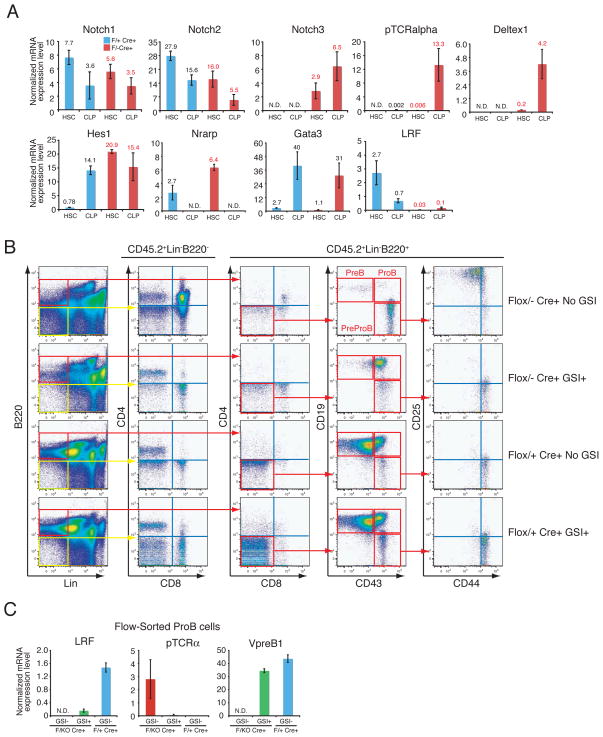
LRF opposes Notch pathways at the HSC/CLP stage. (A) BM-HSCs and CLPs were flow-sorted from pIpC-treated animals one month after the last pIpC injection. q-RT-PCR analysis were performed as described in Fig. 3A. (B) In vivo GSI treatment rescued aberrant lymphoid development in LRF conditional KO mice. Either Zbtb7aFlox/+ Mx1cre+ or Zbtb7aFlox/− Mx1cre+ BMMNCs (CD45.2+) were transplanted into lethally irradiated recipient mice (CD45.1) as described in Fig. 2D. Mice were subsequently treated with pIpC. Either GSI or vehicle alone control was orally administered as described in Methods. Recipients’ BMMNCs were collected and analyzed 3 weeks after the last pIpC administration. (C) RNA was extracted from flow-sorted ProB cells and q-RT-PCR analysis was subsequently performed as described in Fig. 3A.
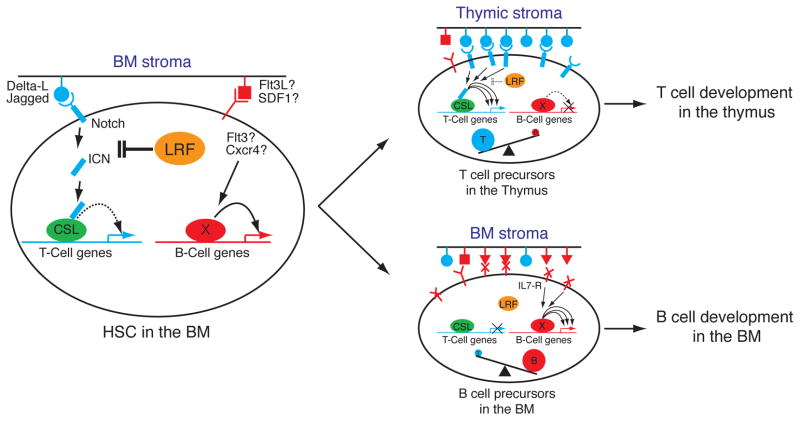
Proposed model for the role of LRF in B versus T lineage fate decision. In BM, where stromal cells express moderate levels of Notch ligands, LRF expression in HSCs and lymphoid progenitors functions to repress T cell-instructive signals produced by Notch (left). However, upon homing of progenitors to the thymus where Notch ligands are more abundantly expressed, this repressive role of LRF on Notch function is overruled hence allowing efficient production of T cell precursors (top right).
Comment in
-
Immunology. Keeping a tight leash on Notch.Science. 2007 May 11;316(5826):840-2. doi: 10.1126/science.1143336. Science. 2007. PMID: 17495159 No abstract available.
References
-
- Kondo M, Weissman IL, Akashi K. Cell. 1997;91:661. - PubMed
-
- Maillard I, Fang T, Pear WS. Annu Rev Immunol. 2005;23:945. - PubMed
-
- Medina KL, Singh H. Curr Opin Hematol. 2005 May;12:203. - PubMed
-
- Davies JM, et al. Oncogene. 1999 Jan 14;18:365. - PubMed
-
- Maeda T, et al. Nature. 2005 Jan 20;433:278. - PubMed
Publication types
MeSH terms
Substances
Grants and funding
LinkOut - more resources
Full Text Sources
Other Literature Sources
Medical
Molecular Biology Databases
