. 2007 Sep 1;93(5):1818-33.
doi: 10.1529/biophysj.107.107052. Epub 2007 May 11.

Stability and robustness of an organelle number control system: modeling and measuring homeostatic regulation of centriole abundance

Affiliations

Stability and robustness of an organelle number control system: modeling and measuring homeostatic regulation of centriole abundance

Wallace F Marshall. Biophys J. .

Abstract

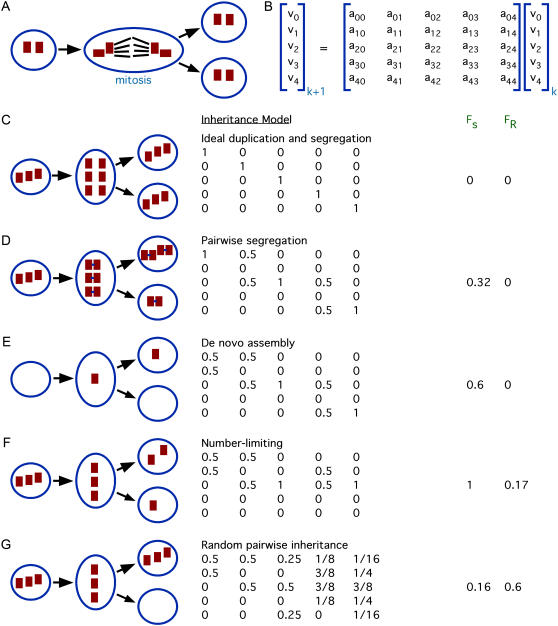
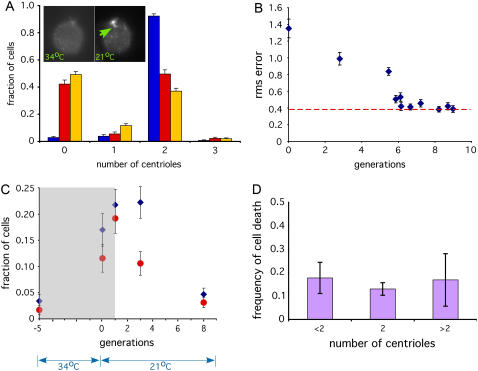
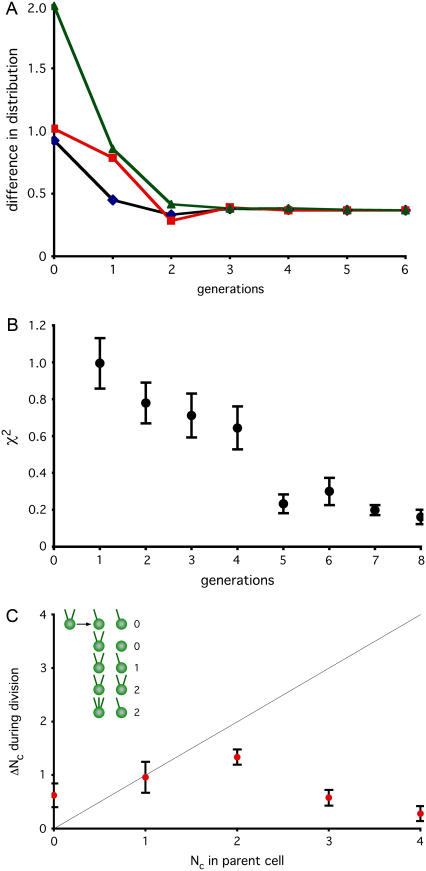
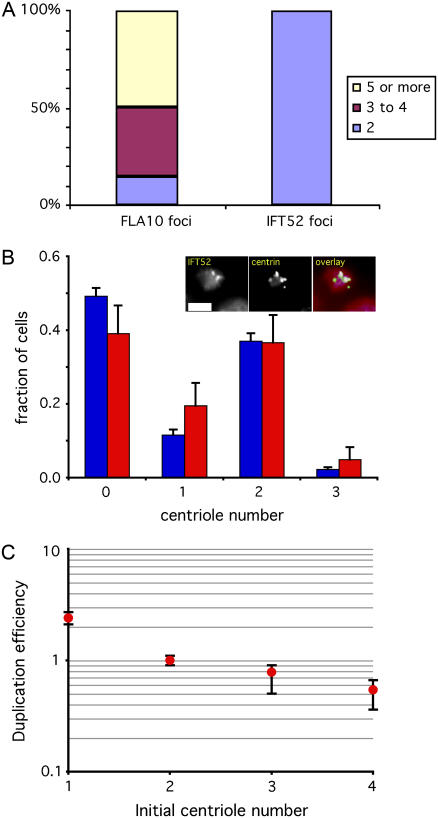
Control of organelle abundance is a fundamental unsolved problem in cell biology. Mechanisms for number control have been proposed in which organelle assembly is actively increased or decreased to compensate for deviations from a set-point, but such phenomena have not been experimentally verified. In this report we examine the control of centriole copy number. We develop a simple scheme to represent organelle inheritance as a first-order Markov process and describe two figures of merit based on entropy and convergence times that can be used to evaluate performance of organelle number control systems. Using this approach we show that segregation of centrioles by the mitotic spindle can shape the specificity of the steady-state centriole number distribution but is neither necessary nor sufficient for stable restoration of centriole number following perturbations. We then present experimental evidence that living cells can restore correct centriole copy number following transient perturbation, revealing a homeostatic control system. We present evidence that correction occurs at the level of single cell divisions, does not require association of centrioles with the mitotic spindle, and involves modulation of centriole assembly as a function of centriole number during S-phase. Combining our experimental and modeling results, we identify two processes required for error correction, de novo assembly and number-limiting, and show that both processes contribute to robust and stable homeostatic control of centriole number, yielding a system capable of suppressing biological noise at the level of organelle abundance.


Figures

FIGURE 1
FIGURE 1
Modeling centriole number control. (A) Centriole inheritance. A cell starts out with two centrioles in the G1 stage of the cell cycle. Each of these gives rise to a “daughter” centriole before division, and then during mitosis two centrioles associate with each pole of the mitotic spindle. This spindle-mediated segregation allows each daughter cell to inherit exactly two centrioles. (B) Markov process model for studying centriole copy-number control. At generation k, number distribution represented by vector whose element vj represent the fraction of cells in the containing j centrioles. Changes in number from one generation to the next are modeling using transition probability matrix whose elements amn specify the probability that a cell with n centrioles will produce a daughter cell with m centrioles. (C) Hypothetical model of perfect duplication and segregation. Whatever number of centrioles a cell has, is propagated exactly to both of its daughters. This system does not have a unique steady-state solution. (D) Hypothetical model including pairwise segregation of mother and daughter centrioles. After duplication, centrioles associate in pairs as shown in the cartoon. (E) Addition of de novo assembly to the pairwise segregation model. The changes to the first column reflect the ability of a cell with zero centrioles to produce a daughter having one centriole, as illustrated in cartoon. (F) Model including number-limiting, de novo assembly, and pairwise segregation. Number limiting prevents cells with three or more centrioles from undergoing duplication. (G) Model in which centriole pairs segregate randomly to daughter cells due to loss of spindle-mediated partitioning. Cartoon illustrates one possible outcome in which a cell with three centrioles segregates all three to one daughter, producing one daughter cell lacking centrioles entirely.
FIGURE 2
FIGURE 2
Experimental testing of centriole copy number homeostasis. (A) The vfl2ts mutant allows reversible generation of centriole number errors. Graph shows distribution of centriole copy numbers in vfl2ts grown at 21°C (blue) and 34°C (red). Copy-number distribution in constitutive vfl2 mutant is included for comparison (gold). (Inset) Images to show recovery of centrin fibers (34°C) on left lacks recognizable fibers when cells are stained with anticentrin antibodies, but after one day of growth following downshift to permissive temperature (21°C) assembly of centrin fibers has been recovered. (B) Dynamic recovery of copy number in vfl2ts following downshift. Copy number determined by counting flagella and computing rms error relative to the nominal wild-type copy number of two per cell. Blue diamonds indicate measured data points. Red dotted line indicates rms error in cells grown continuously at permissive temperature. Graph indicates that copy number error returns to the resting level within six generations following restoration of VFL2 gene function after temperature downshift. Error bars represent 95% confidence intervals. An average of 472 cells were scored per time point. (C) Copy-number restoration confirmed by immunofluorescence. Cells were fixed and stained with rabbit anti-FLA10 kinesin and monoclonal antiacetylated tubulin antibodies, both of which recognize centrioles. Centrioles were detected as foci that stained with both antibodies. Plots indicate fraction of cells containing either too few centrioles (less than two per cell, indicated by blue diamonds) or too many centrioles (more than two per cell, indicated by red circles). Gray shaded box represents the time interval during which cells lack the centrin-based connecting fibers responsible for proper centriole segregation as judged by centrin immunofluorescence. Plot shows that centriole number begins returning to the wild-type distribution as soon as centriole segregation is restored. An average of 212 cells were scored per time-point. (D) Copy-number restoration is not due to selective cell death. We examined individual cell divisions and determined the frequency with which vfl2 cells produce inviable daughter cells. Results from a total of 401 live cell divisions are reported.
FIGURE 3
FIGURE 3
Error correction still occurs when centrioles are dissociated from spindle. (A) Modeling restoration without segregation. A matrix describing inheritance with de novo assembly and number limiting but random segregation (Fig. 1 G) was used to simulate recovery in cells lacking centriole association with mitotic spindle. Initial distribution was set either to a uniform distribution (black line), all cells containing zero centrioles (red line) or all cells containing four centrioles (green line). Successive rounds of matrix multiplication were used to simulate changes in distribution per generation of cell division. At each generation, the distribution was compared to the measured distribution in vfl2 mutants and the difference in calculated and measured distributions was computed using the variational distance measure. (B) Restoration of steady-state vfl2 centriole distribution following perturbation. Mutant vfl2 cells have a variable number of centrioles per cell, with numbers found in a characteristic distribution (see Fig. 2 A). Individual vfl2 cells, having zero, one, or two centrioles, were seeded into wells of 96-well microtiter plate and allowed to undergo multiple rounds of division. At regular time points, cells were observed and the motility of all cells in a well scored to determine the number of centrioles present. For each well, at each generation observed, the distribution of numbers in the well was compared with the normal population-level distribution seen in vfl2 and the difference characterized by the χ-squared statistic. Results for each generation were averaged and plotted. Results were obtained from a total of 176 individual cells (116 with zero centrioles, 27 with one, and 33 with two) tracked from 0 to 4 days. (C) Error correction detected during division of living cells. Individual vfl2 cells were embedded in agarose and were observed before and after division. Graph shows average number of new centrioles (represented on the vertical axis by ΔNc, the change in the number of centrioles) made in a single division plotted versus centriole copy number (Nc) of the parent cell. Only successful cell divisions resulting in viable progeny (as judged by cell morphology and ability to continue dividing at least once more) were included in the plot. Gray line shows prediction for ideal duplication in which each centriole produces exactly one new centriole (hence a line with a slope of 1). Values falling above the line for low Nc and below the line for Nc indicate modulation of duplication in response to centriole copy number. Error bars represent standard error of the mean. Data based on observation of 254 successful cell divisions. Inset illustrates how ΔNc is calculated, by indicating all observed outcomes for division of a cell with two flagella and therefore two centrioles, and showing the calculated value for ΔNc in each case, found by summing the total number of centrioles (as judged by flagella) in both daughters and subtracting the number of centrioles in the mother.
FIGURE 4
FIGURE 4
Centriole number correction occurs during S-phase. (A) IFT52 antibody only recognizes preexisting centrioles during S-phase. ts100021 mutants were grown at 34°C for 24 h, during which time most cells accumulated at least three, and in some cases many more, new centrioles as detected by FLA10 immunofluorescence, as indicated by the colored regions of the first bar in the graph. In contrast, all cells only showed two foci of transition-fiber specific IFT52 staining, confirming that this antibody only recognizes the two centrioles that a cell had when it entered S-phase, and not the newly formed ones, as predicted from the fact that transition fibers, the locus of IFT52 recruitment, do not assemble onto new centrioles until mitosis. (B) Centriole number is not corrected before S-phase. (Blue) Centriole copy-number distribution in vfl2 cells during G1. (Red) Copy-number distribution of preexisting centrioles during S-phase arrest in vfl2 ts100021 as judged by localization of IFT52p. Inset shows typical images in which additional centrioles detectable by centrin immunofluorescence accumulate during S-phase arrest but do not stain with antibodies to IFT52. Graph indicates that the distribution of number at onset of S (as judged by preexisting centrioles) is the same as that seen during G1, indicating that error correction did not occur before the G1-S transition. (C) Duplication efficiency during S-phase is modulated by centriole copy number. Plot shows duplication efficiency, as determined by the number of new centrioles made during a 24-h S-phase arrest, per preexisting centriole, normalized to 1 for cells with two centrioles, plotted on log scale versus initial centriole number. Plot indicates increased duplication for cells with too few centrioles relative to correct copy number, and decreased duplication for cells with too many centrioles. Error bars are standard deviation.
FIGURE 5
FIGURE 5
Role of de novo assembly and number limiting in homeostatic control. (A) Model correctly predicts steady-state vfl2 copy-number distribution. Graph plots prediction of centriole number distribution in vfl2 mutants based on eigenvalue analysis of a transition matrix (inset) derived from experimental outcome probabilities measured in the live-cell pedigree analysis of Fig. 3 C. (Gold) Measured centriole copy number distribution in vfl2 cells. (Gray) Predicted centriole copy-number distribution obtained from the eigenvector corresponding to the predicted steady-state solution. (B) Model correctly predicts recovery kinetics in vfl2ts after downshift. (Blue solid line) Results of simulation as described in Materials and Methods, in which the centriole number distribution is initialized to the actual experimentally observed vfl2 distribution (A, gold bars) and then simulated through multiple rounds of cell division by multiplication with a transition matrix that includes templated duplication, de novo assembly, and number limiting. (Black dotted line with squares) Experimental data taken from Fig. 2 B. (Red, magenta, and green lines) Simulation results for models with reduced probabilities Pdenovo (Pd) and Plimiting (Pl) of activation of de novo assembly and number-limiting, respectively, in cells for which these processes would normally be active. (Red) Pd = Pl = 0.5, (magenta) Pd = Pl = 0.25, (green) Pd = Pl = 0. (C) Contributions of de novo assembly and number limiting to “restoration”. Graph of the restoration figure of merit FR as a function of the probabilities Pdenovo (Pd) and Plimiting (Pl). Graph is color coded with separation of 0.02 between contour lines. Darker green indicates slower predicted restoration of the steady state following a perturbation. (D) Role of de novo assembly and number limiting in noise suppression. Graph plots change of mean-squared centriole copy number error during computer simulation of two rounds of cell division following transient random perturbation of the initial distribution. Axes correspond to Pdenovo and Plimiting as in panel C. Graph is color coded according to the ratio of mean-squared error after cell division to that before cell division. Contour lines give values of the ratio and define distinct regions of parameter space. Regions with a ratio greater than one indicate noise amplification (red and dark red), whereas regions with a ratio less than one indicate noise suppression.

References

    1. Stelling, J., U. Sauer, Z. Szallasi, F. J. Doyle, and J. Doyle. 2004. Robustness of cellular functions. Cell. 118:675–685. - PubMed
    1. El-Samad, H., J. P. Goff, and M. Khammash. 2002. Calcium homeostasis and parturient hypocalcaemia: an integral feedback perspective. J. Theor. Biol. 214:17–29. - PubMed
    1. Tyson, J. J., K. C. Chen, and B. Novak. 2003. Sniffers, buzzers, toggles and blinkers: dynamics of regulatory and signaling pathways in the cell. Curr. Opin. Cell Biol. 15:221–231. - PubMed
    1. Wilson, E. B. 1916. The distribution of the chondriosomes to the spermatozoa in scorpions. Proc. Natl. Acad. Sci. USA. 2:321–324. - PMC - PubMed
    1. Hennis, A. S., and W. Birky. 1984. Stochastic partitioning of chloroplasts at cell division in the alga Olisthodiscus, and compensating control of chloroplast replication. J. Cell Sci. 70:1–15. - PubMed

Publication types

LinkOut - more resources