

Two-state model of acto-myosin attachment-detachment predicts C-process of sinusoidal analysis
- PMID: 17496022
- PMCID: PMC1913148
- DOI: 10.1529/biophysj.106.101626
Two-state model of acto-myosin attachment-detachment predicts C-process of sinusoidal analysis
Abstract
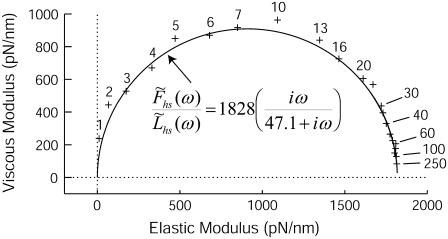
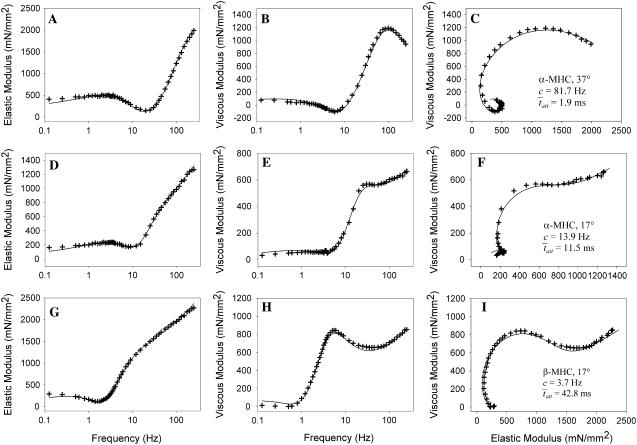
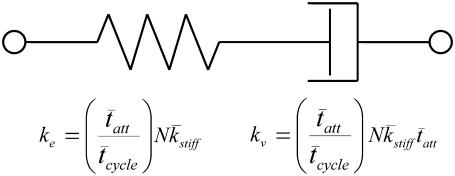
The force response of activated striated muscle to length perturbations includes the so-called C-process, which has been considered the frequency domain representation of the fast single-exponential force decay after a length step (phases 1 and 2). The underlying molecular mechanisms of this phenomenon, however, are still the subject of various hypotheses. In this study, we derived analytical expressions and created a corresponding computer model to describe the consequences of independent acto-myosin cross-bridges characterized solely by 1), intermittent periods of attachment (t(att)) and detachment (t(det)), whose values are stochastically governed by independent probability density functions; and 2), a finite Hookian stiffness (k(stiff)) effective only during periods of attachment. The computer-simulated force response of 20,000 (N) cross-bridges making up a half-sarcomere (F(hs)(t)) to sinusoidal length perturbations (L(hs)(t)) was predicted by the analytical expression in the frequency domain, (F(hs)(omega)/L(hs)(omega))=(t(att)/t(cycle))Nk(stiff)(iomega/(t(att)(-1)+iomega)), where t(att) = mean value of t(att), t(cycle) = mean value of t(att) + t(det), k(stiff) = mean stiffness, and omega = 2pi x frequency of perturbation. The simulated force response due to a length step (L(hs)) was furthermore predicted by the analytical expression in the time domain, F(hs)(t)=(t(att)/t(cycle))Nk(stiff)L(hs)e(-t/t(att)). The forms of these analytically derived expressions are consistent with expressions historically used to describe these specific characteristics of a force response and suggest that the cycling of acto-myosin cross-bridges and their associated stiffnesses are responsible for the C-process and for phases 1 and 2. The rate constant 2pic, i.e., the frequency parameter of the historically defined C-process, is shown here to be equal to t(att)(-1). Experimental results from activated cardiac muscle examined at different temperatures and containing predominately alpha- or beta-myosin heavy chain isoforms were found to be consistent with the above interpretation.
Figures
Similar articles
-
Effect of inorganic phosphate on the force and number of myosin cross-bridges during the isometric contraction of permeabilized muscle fibers from rabbit psoas.Biophys J. 2008 Dec 15;95(12):5798-808. doi: 10.1529/biophysj.108.130435. Epub 2008 Oct 3. Biophys J. 2008. PMID: 18835889 Free PMC article.
-
Sarcomere lattice geometry influences cooperative myosin binding in muscle.PLoS Comput Biol. 2007 Jul;3(7):e115. doi: 10.1371/journal.pcbi.0030115. PLoS Comput Biol. 2007. PMID: 17630823 Free PMC article.
-
The myofilament elasticity and its effect on kinetics of force generation by the myosin motor.Arch Biochem Biophys. 2014 Jun 15;552-553:108-16. doi: 10.1016/j.abb.2014.02.017. Epub 2014 Mar 12. Arch Biochem Biophys. 2014. PMID: 24631572
-
The stiffness of skeletal muscle in isometric contraction and rigor: the fraction of myosin heads bound to actin.Biophys J. 1998 May;74(5):2459-73. doi: 10.1016/S0006-3495(98)77954-8. Biophys J. 1998. PMID: 9591672 Free PMC article.
-
Molecular basis of force development by skeletal muscles during and after stretch.Mol Cell Biomech. 2009 Dec;6(4):229-41. Mol Cell Biomech. 2009. PMID: 19899446 Review.
Cited by
-
Distribution of myosin attachment times predicted from viscoelastic mechanics of striated muscle.J Biomed Biotechnol. 2011;2011:592343. doi: 10.1155/2011/592343. Epub 2011 Nov 17. J Biomed Biotechnol. 2011. PMID: 22190855 Free PMC article.
-
Moderate-intensity resistance exercise alters skeletal muscle molecular and cellular structure and function in inactive older adults with knee osteoarthritis.J Appl Physiol (1985). 2017 Apr 1;122(4):775-787. doi: 10.1152/japplphysiol.00830.2016. Epub 2017 Jan 12. J Appl Physiol (1985). 2017. PMID: 28082334 Free PMC article.
-
Myosin dilated cardiomyopathy mutation S532P disrupts actomyosin interactions, leading to altered muscle kinetics, reduced locomotion, and cardiac dilation in Drosophila.Mol Biol Cell. 2021 Aug 19;32(18):1690-1706. doi: 10.1091/mbc.E21-02-0088. Epub 2021 Jun 3. Mol Biol Cell. 2021. PMID: 34081531 Free PMC article.
-
Influenza Infection has Fiber Type-Specific Effects on Cellular and Molecular Skeletal Muscle Function in Aged Mice.J Gerontol A Biol Sci Med Sci. 2020 Nov 13;75(12):2333-2341. doi: 10.1093/gerona/glaa136. J Gerontol A Biol Sci Med Sci. 2020. PMID: 32492709 Free PMC article.
-
Enhancing diastolic function by strain-dependent detachment of cardiac myosin crossbridges.J Gen Physiol. 2020 Apr 6;152(4):e201912484. doi: 10.1085/jgp.201912484. J Gen Physiol. 2020. PMID: 32197271 Free PMC article.
References
-
- Kawai, M., and P. W. Brandt. 1980. Sinusoidal analysis: a high resolution method for correlating biochemical reactions with physiological processes in activated skeletal muscles of rabbit, frog and crayfish. J. Muscle Res. Cell Motil. 1:279–303. - PubMed
-
- Rossmanith, G. H. 1986. Tension responses of muscle to n-step pseudo-random length reversals: a frequency domain representation. J. Muscle Res. Cell Motil. 7:299–306. - PubMed
-
- Kawai, M., Y. Saeki, and Y. Zhao. 1993. Crossbridge scheme and the kinetic constants of elementary steps deduced from chemically skinned papillary and trabecular muscles of the ferret. Circ. Res. 73:35–50. - PubMed
Publication types
MeSH terms
Substances
Grants and funding
LinkOut - more resources
Full Text Sources
