

Nav channel mechanosensitivity: activation and inactivation accelerate reversibly with stretch
- PMID: 17496023
- PMCID: PMC1913161
- DOI: 10.1529/biophysj.106.101246
Nav channel mechanosensitivity: activation and inactivation accelerate reversibly with stretch
Abstract
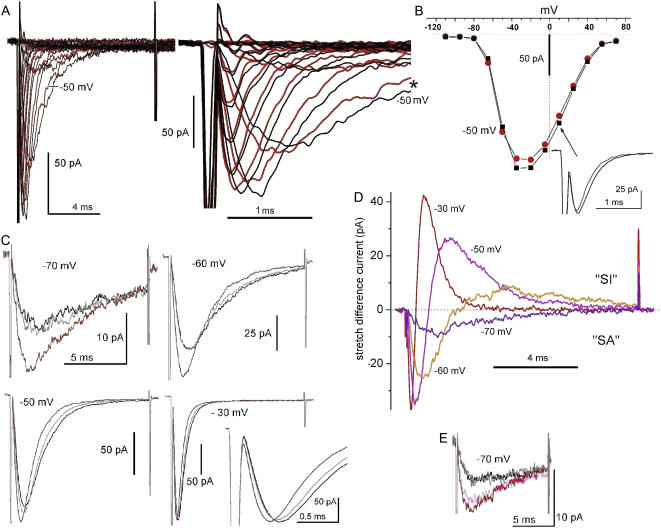
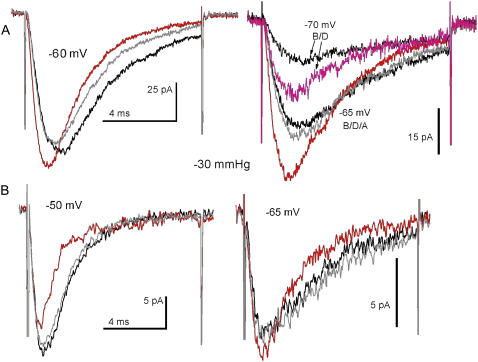
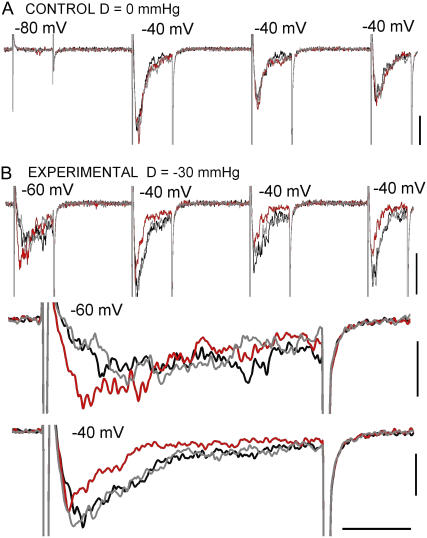
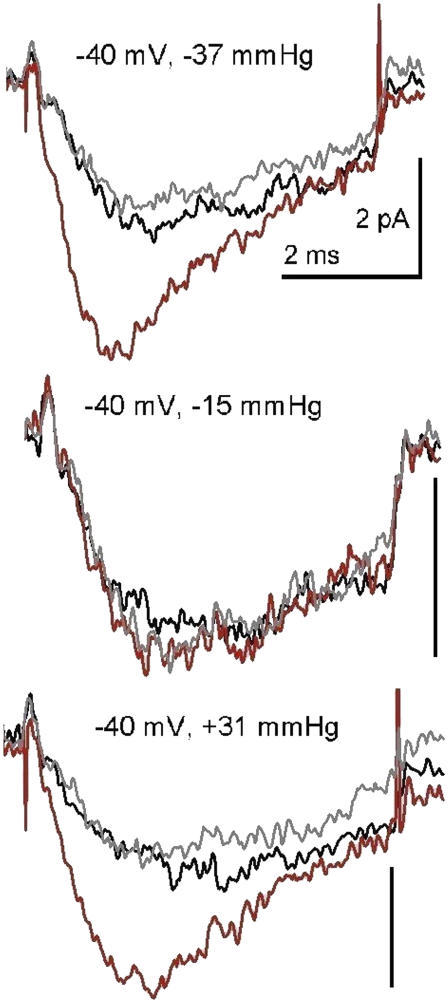
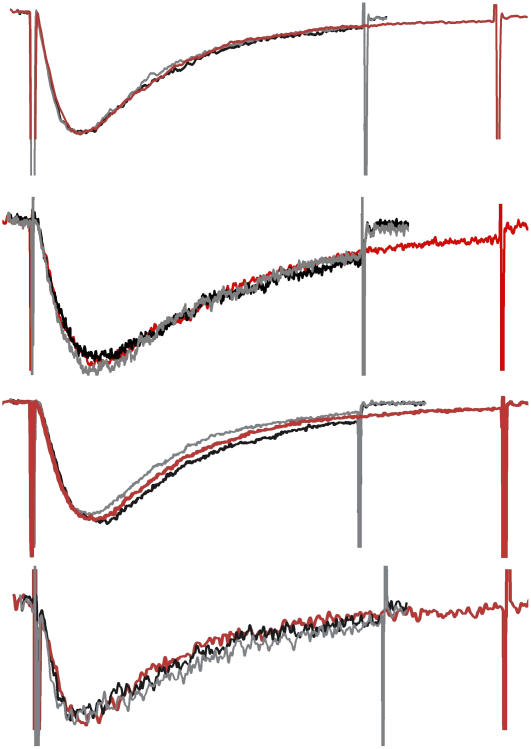
Voltage-gated sodium channels (Nav) are modulated by many bilayer mechanical amphiphiles, but whether, like other voltage-gated channels (Kv, HCN, Cav), they respond to physical bilayer deformations is unknown. We expressed human heart Nav1.5 pore alpha-subunit in oocytes (where, unlike alphaNav1.4, alphaNav1.5 exhibits normal kinetics) and measured small macroscopic currents in cell-attached patches. Pipette pressure was used to reversibly stretch the membrane for comparison of I(Na)(t) before, during, and after stretch. At all voltages, and in a dose-dependent fashion, stretch accelerated the I(Na)(t) time course. The sign of membrane curvature was not relevant. Typical stretch stimuli reversibly accelerated both activation and inactivation by approximately 1.4-fold; normalization of peak I(Na)(t) followed by temporal scaling ( approximately 1.30- to 1.85-fold) resulted in full overlap of the stretch/no-stretch traces. Evidently the rate-limiting outward voltage sensor motion in the Nav1.5 activation path (as in Kv1) accelerated with stretch. Stretch-accelerated inactivation occurred even with activation saturated, so an independently stretch-modulated inactivation transition is also a possibility. Since Nav1.5 channel-stretch modulation was both reliable and reversible, and required stretch stimuli no more intense than what typically activates putative mechanotransducer channels (e.g., stretch-activated TRPC1-based currents), Nav channels join the ranks of putative mechanotransducers. It is noteworthy that at voltages near the activation threshold, moderate stretch increased the peak I(Na) amplitude approximately 1.5-fold. It will be important to determine whether stretch-modulated Nav current contributes to cardiac arrhythmias, to mechanosensory responses in interstitial cells of Cajal, to touch receptor responses, and to neuropathic (i.e., hypermechanosensitive) and/or normal pain reception.
Figures
Similar articles
-
Impaired stretch modulation in potentially lethal cardiac sodium channel mutants.Channels (Austin). 2010 Jan-Feb;4(1):12-21. doi: 10.4161/chan.4.1.10260. Epub 2010 Jan 6. Channels (Austin). 2010. PMID: 20090423
-
Membrane trauma and Na+ leak from Nav1.6 channels.Am J Physiol Cell Physiol. 2009 Oct;297(4):C823-34. doi: 10.1152/ajpcell.00505.2008. Epub 2009 Aug 5. Am J Physiol Cell Physiol. 2009. PMID: 19657055
-
State-dependent trapping of flecainide in the cardiac sodium channel.J Physiol. 2004 Oct 1;560(Pt 1):37-49. doi: 10.1113/jphysiol.2004.065003. Epub 2004 Jul 22. J Physiol. 2004. PMID: 15272045 Free PMC article.
-
Studying the mechanosensitivity of voltage-gated channels using oocyte patches.Methods Mol Biol. 2006;322:315-29. doi: 10.1007/978-1-59745-000-3_22. Methods Mol Biol. 2006. PMID: 16739733 Review.
-
Adaptive evolution of voltage-gated sodium channels: the first 800 million years.Proc Natl Acad Sci U S A. 2012 Jun 26;109 Suppl 1(Suppl 1):10619-25. doi: 10.1073/pnas.1201884109. Epub 2012 Jun 20. Proc Natl Acad Sci U S A. 2012. PMID: 22723361 Free PMC article. Review.
Cited by
-
Left-shifted nav channels in injured bilayer: primary targets for neuroprotective nav antagonists?Front Pharmacol. 2012 Feb 23;3:19. doi: 10.3389/fphar.2012.00019. eCollection 2012. Front Pharmacol. 2012. PMID: 22375118 Free PMC article.
-
A Review on Brain Stimulation Using Low Intensity Focused Ultrasound.Basic Clin Neurosci. 2016 Jul;7(3):187-94. doi: 10.15412/J.BCN.03070303. Basic Clin Neurosci. 2016. PMID: 27563411 Free PMC article. Review.
-
Focusing in on the Future of Focused Ultrasound as a Translational Tool.Brain Sci. 2022 Jan 25;12(2):158. doi: 10.3390/brainsci12020158. Brain Sci. 2022. PMID: 35203922 Free PMC article. Review.
-
Voltage-gated channel mechanosensitivity: fact or friction?Front Physiol. 2011 May 31;2:25. doi: 10.3389/fphys.2011.00025. eCollection 2011. Front Physiol. 2011. PMID: 21660289 Free PMC article.
-
Ultrasound Stimulation of Insulin Release from Pancreatic Beta Cells as a Potential Novel Treatment for Type 2 Diabetes.Ultrasound Med Biol. 2017 Jun;43(6):1210-1222. doi: 10.1016/j.ultrasmedbio.2017.01.007. Epub 2017 Mar 25. Ultrasound Med Biol. 2017. PMID: 28347531 Free PMC article.
References
-
- Darbon, P., C. Yvon, J. C. Legrand, and J. Streit. 2004. INaP underlies intrinsic spiking and rhythm generation in networks of cultured rat spinal cord neurons. Eur. J. Neurosci. 20:976–988. - PubMed
-
- Bolanowski, S. J., Jr. 1984. Intensity and frequency characteristics of pacinian corpuscles. III. Effects of tetrodotoxin on transduction process. J. Neurophysiol. 51:831–839. - PubMed
-
- Pawson, L., and S. J. Bolanowski. 2002. Voltage-gated sodium channels are present on both the neural and capsular structures of Pacinian corpuscles. Somatosens. Mot. Res. 19:231–237. - PubMed
-
- Fedida, D., P. M. Orth, J. C. Hesketh, and A. M. Ezrin. 2006. The role of late I and antiarrhythmic drugs in EAD formation and termination in Purkinje fibers. J. Cardiovasc. Electrophysiol. 17(Suppl 1):S71–S78. - PubMed
Publication types
MeSH terms
Substances
LinkOut - more resources
Full Text Sources
Other Literature Sources
Miscellaneous
