Mechanical properties of inner-arm dynein-f (dynein I1) studied with in vitro motility assays
- PMID: 17496036
- PMCID: PMC1913158
- DOI: 10.1529/biophysj.106.101964
Mechanical properties of inner-arm dynein-f (dynein I1) studied with in vitro motility assays
Abstract
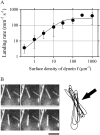
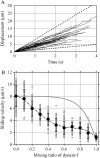
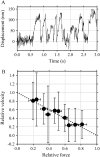
Inner-arm dynein-f of Chlamydomonas flagella is a heterodimeric dynein. We performed conventional in vitro motility assays showing that dynein-f translocates microtubules at the comparatively low velocity of approximately 1.2 microm/s. From the dependence of velocity upon the surface density of dynein-f, we estimate its duty ratio to be 0.6-0.7. The relation between microtubule landing rate and surface density of dynein-f are well fitted by the first-power dependence, as expected for a processive motor. At low dynein densities, progressing microtubules rotate erratically about a fixed point on the surface, at which a single dynein-f molecule is presumably located. We conclude that dynein-f has high processivity. In an axoneme, however, slow and processive dynein-f could impede microtubule sliding driven by other fast dyneins (e.g., dynein-c). To obtain insight into the in vivo roles of dynein-f, we measured the sliding velocity of microtubules driven by a mixture of dyneins -c and -f at various mixing ratios. The velocity is modulated as a function of the ratio of dynein-f in the mixture. This modulation suggests that dynein-f acts as a load in the axoneme, but force pushing dynein-f molecules forward seems to accelerate their dissociation from microtubules.
Figures


Similar articles
-
Inner-arm dynein c of Chlamydomonas flagella is a single-headed processive motor.Nature. 1999 Aug 5;400(6744):586-90. doi: 10.1038/23066. Nature. 1999. PMID: 10448863
-
Regulation of Chlamydomonas flagellar dynein by an axonemal protein kinase.J Cell Biol. 1994 Dec;127(6 Pt 1):1683-92. doi: 10.1083/jcb.127.6.1683. J Cell Biol. 1994. PMID: 7798320 Free PMC article.
-
Slow axonemal dynein e facilitates the motility of faster dynein c.Biophys J. 2014 May 20;106(10):2157-65. doi: 10.1016/j.bpj.2014.04.009. Biophys J. 2014. PMID: 24853744 Free PMC article.
-
Keeping an eye on I1: I1 dynein as a model for flagellar dynein assembly and regulation.Cell Motil Cytoskeleton. 2007 Aug;64(8):569-79. doi: 10.1002/cm.20211. Cell Motil Cytoskeleton. 2007. PMID: 17549744 Review.
-
Big steps toward understanding dynein.J Cell Biol. 2013 Jul 8;202(1):15-23. doi: 10.1083/jcb.201304099. J Cell Biol. 2013. PMID: 23836927 Free PMC article. Review.
Cited by
-
A dynein-associated photoreceptor protein prevents ciliary acclimation to blue light.Sci Adv. 2021 Feb 26;7(9):eabf3621. doi: 10.1126/sciadv.abf3621. Print 2021 Feb. Sci Adv. 2021. PMID: 33637535 Free PMC article.
-
Axonemal structures reveal mechanoregulatory and disease mechanisms.Nature. 2023 Jun;618(7965):625-633. doi: 10.1038/s41586-023-06140-2. Epub 2023 May 31. Nature. 2023. PMID: 37258679 Free PMC article.
-
Asymmetry of inner dynein arms and inter-doublet links in Chlamydomonas flagella.J Cell Biol. 2009 Aug 10;186(3):437-46. doi: 10.1083/jcb.200903082. J Cell Biol. 2009. PMID: 19667131 Free PMC article.
-
Active fluctuations of axoneme oscillations scale with number of dynein motors.Proc Natl Acad Sci U S A. 2024 Nov 12;121(46):e2406244121. doi: 10.1073/pnas.2406244121. Epub 2024 Nov 5. Proc Natl Acad Sci U S A. 2024. PMID: 39499635 Free PMC article.
-
Silencing of a putative inner arm dynein heavy chain results in flagellar immotility in Trypanosoma brucei.Mol Biochem Parasitol. 2011 Jan;175(1):68-75. doi: 10.1016/j.molbiopara.2010.09.005. Epub 2010 Oct 1. Mol Biochem Parasitol. 2011. PMID: 20888370 Free PMC article.
References
-
- Snell, W. J., J. Pan, and Q. Wang. 2004. Cilia and flagella revealed: from flagellar assembly in Chlamydomonas to human obesity disorders. Cell. 117:693–697. - PubMed
-
- Pazour, G. J., and G. B. Witman. 2003. The vertebrate primary cilium is a sensory organelle. Curr. Opin. Cell Biol. 15:105–110. - PubMed
-
- Marshall, W. F., and S. Nonaka. 2006. Cilia: tuning in to the cell's antenna. Curr. Biol. 16:R604–R614. - PubMed
-
- Kamiya, R. 2002. Functional diversity of axonemal dyneins as studied in Chlamydomonas mutants. Int. Rev. Cytol. 219:115–155. - PubMed
Publication types
MeSH terms
Substances
LinkOut - more resources
Full Text Sources
Other Literature Sources

