. 2007 Aug 1;93(3):795-805.
doi: 10.1529/biophysj.106.097915. Epub 2007 May 11.

Step length measurement--theory and simulation for tethered bead constant-force single molecule assay

Affiliations

Step length measurement--theory and simulation for tethered bead constant-force single molecule assay

Anders E Wallin et al. Biophys J. .

Abstract

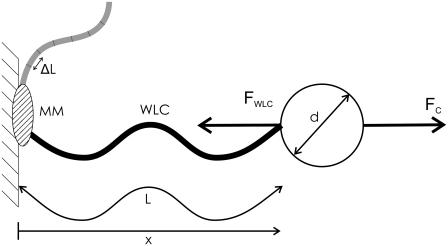
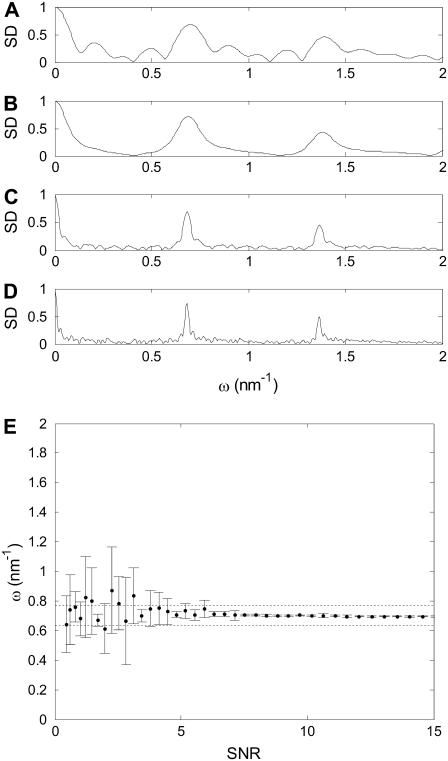
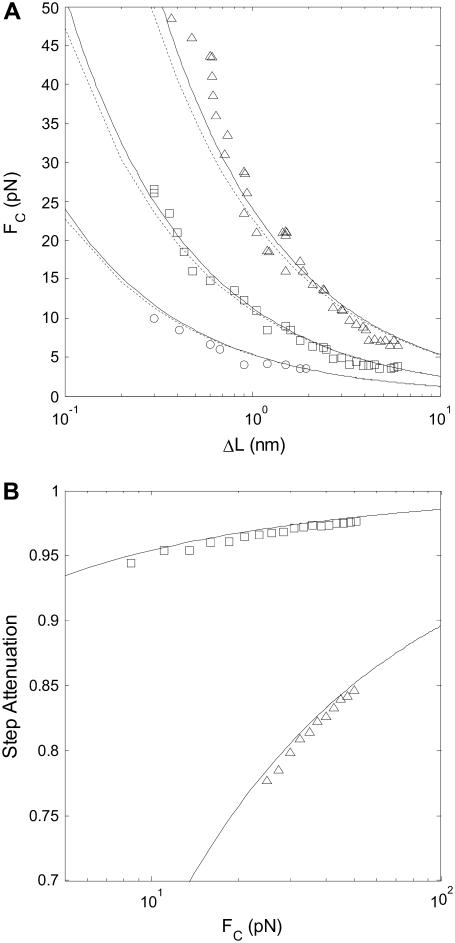
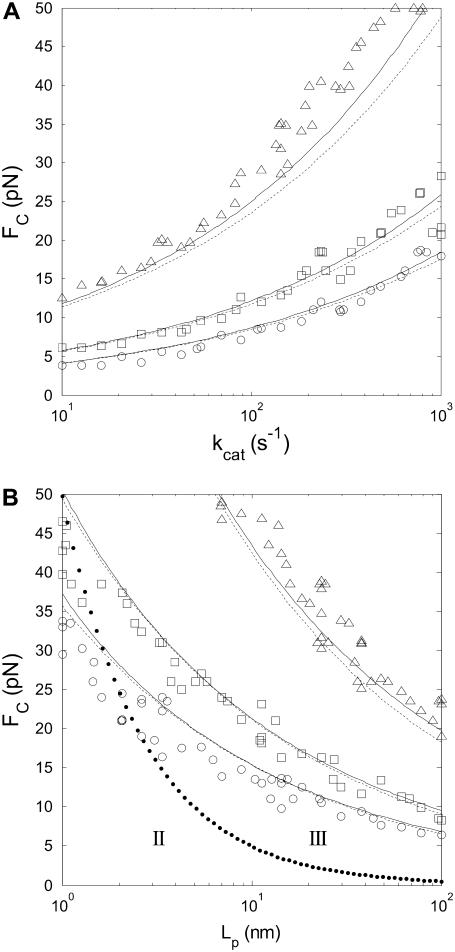
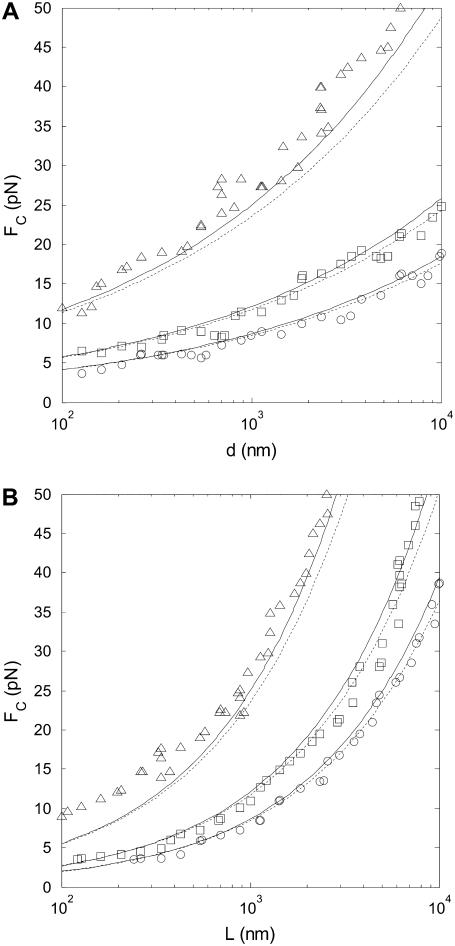
Linear molecular motors translocate along polymeric tracks using discrete steps. The step length is usually measured using constant-force single molecule experiments in which the polymer is tethered to a force-clamped microsphere. During the enzymatic cycle the motor shortens the tether contour length. Experimental conditions influence the achievable step length resolution, and ideally experiments should be conducted with high clamp-force using slow motors linked to small beads via stiff short tethers. We focus on the limitations that the polymer-track flexibility, the thermal motion of the microsphere, and the motor kinetics pose for step-length measurement in a typical optical tweezers experiment. An expression for the signal/noise ratio in a constant-force, worm-like chain tethered particle, single-molecule experiment is developed. The signal/noise ratio is related to the Fourier transform of the pairwise distance distribution, commonly used to determine step length from a time-series. Monte Carlo simulations verify the proposed theory for experimental parameter values typically encountered with molecular motors (polymerases and helicases) translocating along single- or double-stranded nucleic acids. The predictions are consistent with recent experimental results for double-stranded DNA tethers. Our results map favorable experimental conditions for observing single motor steps on various substrates but indicate that principal resolution limits are set by thermal fluctuations.


Figures

FIGURE 1
FIGURE 1
Model for single-molecule motor experiment. A microsphere (diameter d) is tethered to a stationary sample chamber by an NA modeled as a worm-like chain (WLC) with contour length L, end-to-end distance x, and persistence length Lp. The effect of a molecular motor (MM) is modeled by successively shortening the contour length of the WLC by an amount ΔL, the molecular motor step length. The microsphere is held in a force-clamp with a constant pulling force FC, balanced by the counter-force FWLC.
FIGURE 2
FIGURE 2
(A) Extension as a function of force for the nondimensional WLC model. The solid line indicates an exact solution to Eq. 3. Circles, triangles, and squares indicate exponential, logarithmic, and polynomial approximations, respectively. Each approximation is accurate to ±10% in its force region, indicated by dotted lines. (B) Nondimensional stiffness as a function of force. The solid line is calculated from Eq. 5. Triangles and squares indicate linear and polynomial approximations, respectively. Force regions as in panel A. Typical experimental forces of between 1 and 50 pN correspond to the high force range (III) for a WLC with Lp = 50 nm (dsNA), and to the medium force range (II) region when Lp = 1 nm (ssNA).
FIGURE 3
FIGURE 3
The simple SNR formulas (symbols, Eqs. 13–15) approximate the exact SNR (solid line, Eq. 10) well. The SNR for detecting steps in an experiment with a 1-μm diameter bead in water at room temperature (T = 300 K, η = 1 mPas) and a 100 Hz bandwidth is shown. WLC contour length was 1 μm, and two cases are shown: Lp = 50 nm (A) and Lp = 1 nm (B), corresponding to dsNA and ssNA, respectively. The upper and lower curves are the SNR for detecting a 1.5 nm and a 0.3 nm step, respectively. Symbols correspond to the force regions as in Fig. 2 A: squares in the high force region (III), Eq. 15, and triangles in the medium force region (II), Eqs. 13 and 14.
FIGURE 4
FIGURE 4
(A) Typical simulated time-series (sampled data in shaded, filtered in solid representation). (B) Pairwise distance distribution (PWD) for the filtered data in panel A. (C) Fourier transform of the pairwise distance distribution (FTPWD) in panel B. Note that due to step attenuation, the peak in the FTPWD is displaced toward a higher spatial frequency compared to the frequency corresponding to ΔL (dashed line).
FIGURE 5
FIGURE 5
(AD) FTPWD graphs when analyzing time-series with different number of steps, to determine the influence of time-series length on the SD and the determined step length. A short time-series (five steps, A) results in multiple broad peaks. The false peaks are absent in the curve for 10 steps (B), but the main peaks remain broad. A time-series of 20 steps (C) shows well-defined peaks that allow step-length determination with 10% accuracy. Further lengthening the time-series (40 steps, D) improves step length measurement only little. All FTPWD curves show roughly equal SNR (the peaks are equally high). (E) Measured step length as a function of SNR. The average and standard deviation of the determined step length from 10 simulations is shown. Step length can be accurately determined when SNR ≥ 4. Dashed lines correspond to step lengths of 90 and 110% of the true (corrected for attenuation) step length.
FIGURE 6
FIGURE 6
(A) SNR is inversely proportional to step length ΔL. Simulated step detection threshold contours (SNR = 4) as a function of FC, for step lengths ΔL = 0.3–6 nm at different stepping rates: kcat = 10 s−1 (triangles), kcat = 100 s−1 (squares), and kcat = 1000 s−1 (circles). Solid lines indicate step detection thresholds calculated from the exact formula, Eq. 10, and dashed lines indicate the SNR threshold calculated from the approximate formula, Eq. 25. L = 1000 nm, Lp = 50 nm, and d = 1000 nm. (B) Measured step lengths are attenuated by the nondimensional extension of the WLC. Step attenuation (ratio of measured to true step length) as a function of FC, for persistence lengths of Lp = 50 nm (squares) and Lp = 1 nm (triangles). The measured step length was determined from the spatial frequency of a peak in the FTPWD. Lines indicate theoretical prediction, Eq. 9.
FIGURE 7
FIGURE 7
(A) SNR is inversely proportional to the square-root of the measurement bandwidth fLP, and proportional to formula image Simulated step detection threshold contours (SNR = 4) as a function of FC for stepping rates between 10 s−1 and 1000 s−1, and (B) for persistence lengths between 1 nm and 100 nm. Contours for three step lengths are shown, ΔL = 0.3 nm (triangles), ΔL = 0.9 nm (squares), and ΔL = 1.5 nm (circles). Solid lines indicate step detection thresholds calculated from the exact formula, Eq. 10, and dashed lines indicate the SNR threshold calculated from the approximate formula, Eq. 25. L = 1000 nm, d = 1000 nm, in (A) Lp = 50 nm, and in (B) kcat = 100 s−1. In panel B, the dotted line indicates the border between the high-force (III) and the medium-force (II) regions.
FIGURE 8
FIGURE 8
SNR is inversely proportional to the square-root of the bead radius, and inversely proportional to the WLC contour length. Simulated step detection threshold contours (SNR = 4) as a function of FC for (A) microsphere diameters between 0.1 and 10 μm, and (B) for WLC contour lengths between 100 nm and 10 μm. Contours for three step lengths are shown: ΔL = 0.3 nm (triangles), ΔL = 0.9 nm (squares), and ΔL = 1.5 nm (circles). Solid lines indicate step detection thresholds calculated from the exact formula, Eq. 10, and dashed lines indicate the SNR threshold calculated from the approximate formula, Eq. 25. Lp = 50 nm, kcat = 100 s−1, in (A) L = 1000 nm, and in (B) d = 1000 nm.

References

    1. Harada, Y., T. Funatsu, K. Murakami, Y. Nonoyama, A. Ishihama, and T. Yanagida. 1999. Single-molecule imaging of RNA polymerase-DNA interactions in real time. Biophys. J. 76:709–715. - PMC - PubMed
    1. Shaevitz, J. W., E. A. Abbondanzieri, R. Landick, and S. M. Block. 2003. Backtracking by single RNA polymerase molecules observed at near-base-pair resolution. Nature. 426:684–687. - PMC - PubMed
    1. Yin, H., M. D. Wang, K. Svoboda, R. Landick, S. M. Block, and J. Gelles. 1995. Transcription against an applied force. Science. 270:1653–1657. - PubMed
    1. Skinner, G. M., C. G. Baumann, D. M. Quinn, J. E. Molloy, and J. G. Hoggett. 2004. Promoter binding, initiation, and elongation by bacteriophage T7 RNA polymerase. A single-molecule view of the transcription cycle. J. Biol. Chem. 279:3239–3244. - PubMed
    1. Guthold, M., X. Zhu, C. Rivetti, G. Yang, N. H. Thomson, S. Kasas, H. G. Hansma, B. Smith, P. K. Hansma, and C. Bustamante. 1999. Direct observation of one-dimensional diffusion and transcription by Escherichia coli RNA polymerase. Biophys. J. 77:2284–2294. - PMC - PubMed

Publication types

LinkOut - more resources