

UDP-glucose 4-epimerase isoforms UGE2 and UGE4 cooperate in providing UDP-galactose for cell wall biosynthesis and growth of Arabidopsis thaliana
- PMID: 17496119
- PMCID: PMC1913733
- DOI: 10.1105/tpc.106.049619
UDP-glucose 4-epimerase isoforms UGE2 and UGE4 cooperate in providing UDP-galactose for cell wall biosynthesis and growth of Arabidopsis thaliana
Abstract
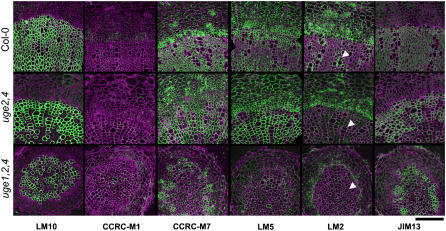
Five Arabidopsis thaliana genes that encode UDP-glucose 4-epimerase (UGE) and represent two ancient plant UGE clades might be involved in the regulation of cell wall carbohydrate biosynthesis. We tested this hypothesis in a genome-wide reverse genetic study. Despite significant contributions of each gene to total UGE activity, none was essential for normal growth on soil. uge2 uge4 displayed dramatic general growth defects, while other mutant combinations were partially aberrant. UGE2 together with UGE3 influenced pollen development. UGE2 and UGE4 synergistically influenced cell wall galactose content, which was correlated with shoot growth. UGE2 strongly and UGE1 and UGE5 lightly supported UGE4 in influencing root growth and cell wall galactose content by affecting galactan content. By contrast, only UGE4 influenced xyloglucan galactosylation in roots. Secondary hypocotyl thickening and arabinogalactan protein carbohydrate structure in xylem parenchyma depended on the combination of UGE2 and UGE4. As opposed to cell wall galactose content, tolerance to external galactose strictly paralleled total UGE activity. We suggest a gradual recruitment of individual UGE isoforms into specific roles. UGE2 and UGE4 influence growth and cell wall carbohydrate biosynthesis throughout the plant, UGE3 is specialized for pollen development, and UGE1 and UGE5 might act in stress situations.
Figures


Similar articles
-
UGE1 and UGE2 regulate the UDP-glucose/UDP-galactose equilibrium in Cryptococcus neoformans.Eukaryot Cell. 2008 Dec;7(12):2069-77. doi: 10.1128/EC.00189-08. Epub 2008 Sep 26. Eukaryot Cell. 2008. PMID: 18820075 Free PMC article.
-
Distinct properties of the five UDP-D-glucose/UDP-D-galactose 4-epimerase isoforms of Arabidopsis thaliana.J Biol Chem. 2006 Jun 23;281(25):17276-17285. doi: 10.1074/jbc.M512727200. Epub 2006 Apr 27. J Biol Chem. 2006. PMID: 16644739
-
Growth regulators and the control of nucleotide sugar flux.Plant Cell. 2004 Mar;16(3):723-30. doi: 10.1105/tpc.019661. Epub 2004 Feb 18. Plant Cell. 2004. PMID: 14973160 Free PMC article.
-
Identification and characterization of an Arabidopsis mutant with altered localization of NIP5;1, a plasma membrane boric acid channel, reveals the requirement for D-galactose in endomembrane organization.Plant Cell Physiol. 2014 Apr;55(4):704-14. doi: 10.1093/pcp/pct191. Epub 2013 Dec 15. Plant Cell Physiol. 2014. PMID: 24343997
-
UDP-D-galactose synthesis by UDP-glucose 4-epimerase 4 is required for organization of the trans-Golgi network/early endosome in Arabidopsis thaliana root epidermal cells.J Plant Res. 2015 Sep;128(5):863-73. doi: 10.1007/s10265-015-0737-4. Epub 2015 May 27. J Plant Res. 2015. PMID: 26013532
Cited by
-
UGE1 and UGE2 regulate the UDP-glucose/UDP-galactose equilibrium in Cryptococcus neoformans.Eukaryot Cell. 2008 Dec;7(12):2069-77. doi: 10.1128/EC.00189-08. Epub 2008 Sep 26. Eukaryot Cell. 2008. PMID: 18820075 Free PMC article.
-
The dehydration stress of couch grass is associated with its lipid metabolism, the induction of transporters and the re-programming of development coordinated by ABA.BMC Genomics. 2018 May 2;19(1):317. doi: 10.1186/s12864-018-4700-3. BMC Genomics. 2018. PMID: 29720087 Free PMC article.
-
Protein expression in tension wood formation monitored at high tissue resolution in Populus.J Exp Bot. 2017 Jun 15;68(13):3405-3417. doi: 10.1093/jxb/erx186. J Exp Bot. 2017. PMID: 28633298 Free PMC article.
-
Identification of multiple salicylic acid-binding proteins using two high throughput screens.Front Plant Sci. 2015 Jan 12;5:777. doi: 10.3389/fpls.2014.00777. eCollection 2014. Front Plant Sci. 2015. PMID: 25628632 Free PMC article.
-
Expression of a fungal exo-β-1,3-galactanase in Arabidopsis reveals a role of type II arabinogalactans in the regulation of cell shape.J Exp Bot. 2020 Sep 19;71(18):5414-5424. doi: 10.1093/jxb/eraa236. J Exp Bot. 2020. PMID: 32470141 Free PMC article.
References
-
- Andeme-Onzighi, C., Sivaguru, M., Judy-March, J., Baskin, T.I., and Driouich, A. (2002). The reb1-1 mutation of Arabidopsis alters the morphology of trichoblasts, the expression of arabinogalactan-proteins and the organization of cortical microtubules. Planta 215 949–958. - PubMed
-
- Arabidopsis Genome Initiative (2000). Analysis of the genome sequence of the flowering plant Arabidopsis thaliana. Nature 408 796–815. - PubMed
-
- Barber, C., Rosti, J., Rawat, A., Findlay, K., Roberts, K., and Seifert, G.J. (2006). Distinct properties of the five UDP-D-glucose/UDP-D-galactose 4-epimerase isoforms of Arabidopsis thaliana. J. Biol. Chem. 281 17276–17285. - PubMed
-
- Barton, C.J., Tailford, L.E., Welchman, H., Zhang, Z., Gilbert, H.J., Dupree, P., and Goubet, F. (2006). Enzymatic fingerprinting of Arabidopsis pectic polysaccharides using polysaccharide analysis by carbohydrate gel electrophoresis (PACE). Planta 224 163–174. - PubMed
-
- Baskin, T.I., Betzner, A.S., Hoggart, R., Cork, A., and Williamson, R.E. (1992). Root morphology mutants in Arabidopsis thaliana. Aust. J. Plant Physiol. 19 427–437.
Publication types
MeSH terms
Substances
Grants and funding
LinkOut - more resources
Full Text Sources
Other Literature Sources
Molecular Biology Databases
Research Materials
