

Brain region binding of the D2/3 agonist [11C]-(+)-PHNO and the D2/3 antagonist [11C]raclopride in healthy humans
- PMID: 17497628
- PMCID: PMC6870740
- DOI: 10.1002/hbm.20392
Brain region binding of the D2/3 agonist [11C]-(+)-PHNO and the D2/3 antagonist [11C]raclopride in healthy humans
Abstract
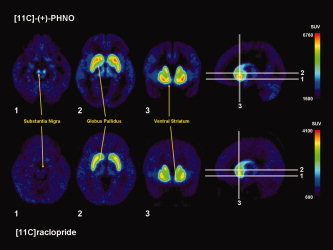
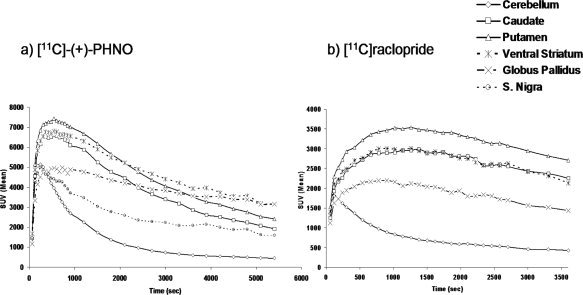
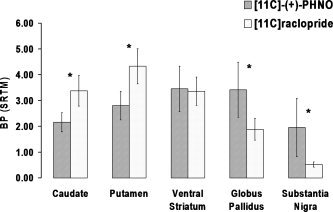
The D(2) receptors exist in either the high- or low-affinity state with respect to agonists, and while agonists bind preferentially to the high-affinity state, antagonists do not distinguish between the two states. [(11)C]-(+)-PHNO is a PET D(2) agonist radioligand and therefore provides a preferential measure of the D(2) (high) receptors. In contrast, [(11)C]raclopride is an antagonist radioligand and thus binds with equal affinity to the D(2) high- and low-affinity states. The aim was to compare the brain uptake, distribution and binding characteristics between [(11)C]-(+)-PHNO and [(11)C]raclopride in volunteers using a within-subject design. Both radioligands accumulated in brain areas rich in D(2)/D(3)-receptors. However, [(11)C]-(+)-PHNO showed preferential uptake in the ventral striatum and globus pallidus, while [(11)C]raclopride showed preferential uptake in the dorsal striatum. Mean binding potentials were higher in the putamen (4.3 vs. 2.8) and caudate (3.4 vs 2.1) for [(11)C]raclopride, equal in the ventral-striatum (3.4 vs. 3.3), and higher in the globus pallidus for [(11)C]-(+)-PHNO (1.8 vs. 3.3). Moreover [(11)C]-(+)-PHNO kinetics in the globus pallidus showed a slower washout than other regions. One explanation for the preferential binding of [(11)C]-(+)-PHNO in the globus pallidus and ventral-striatum could be the presence of a greater proportion of high- vs. low-affinity receptors in these areas. Alternatively, the observed distribution could also be explained by a preferential binding of D(3)-over-D(2) with [(11)C]-(+)-PHNO. This differential binding of agonist vs. antagonist radioligand, especially in the critically important region of the limbic striatum/pallidum, offers new avenues to investigate the role of the dopamine system in health and disease.
(c) 2007 Wiley-Liss, Inc.
Figures

References
-
- Camps M,Cortes R,Gueye B,Probst A,Palacios JM ( 1989): Dopamine receptors in human brain: Autoradiographic distribution of D2 sites. Neuroscience 28: 275–290. - PubMed
-
- De Keyser J,De Backer JP,Convents A ( 1985): D2 dopamine receptors in calf globus pallidus: Agonist high‐ and low‐affinity sites not regulated by guanine nucleotide. J Neurochem 45: 977–978. - PubMed
-
- De Keyser J,Claeys A,De Backer JP,Ebinger G,Roels F,Vauquelin G ( 1988): Autoradiographic localization of D1 and D2 dopamine receptors in the human brain. Neurosci Lett 91: 142–147. - PubMed
-
- De Lean A,Stadel JM,Lefkowitz RJ ( 1980): A ternary complex model explains the agonist‐specific binding properties of the adenylate cyclase‐coupled beta‐adrenergic receptor. J Biol Chem 255: 7108–7117. - PubMed
-
- de Vries DJ,Beart PM ( 1986): Role of assay conditions in determining agonist potency at D2 dopamine receptors in striatal homogenates. Brain Res 387: 29–35. - PubMed
Publication types
MeSH terms
Substances
LinkOut - more resources
Full Text Sources
