

Distinctive topologies of partner-switching signaling networks correlate with their physiological roles
- PMID: 17498739
- PMCID: PMC2727513
- DOI: 10.1016/j.jmb.2007.04.021
Distinctive topologies of partner-switching signaling networks correlate with their physiological roles
Abstract
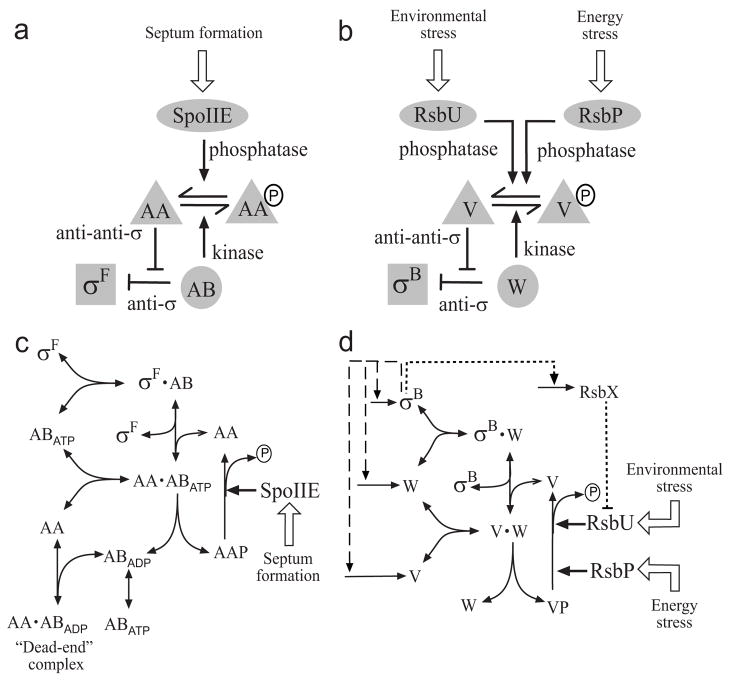
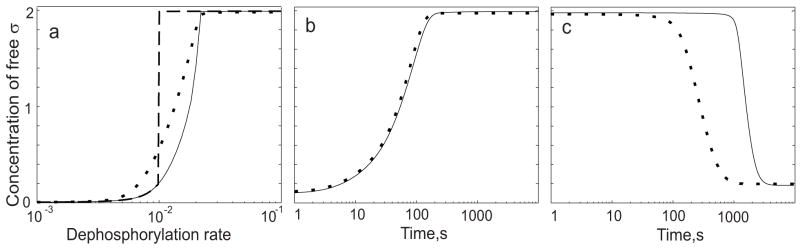
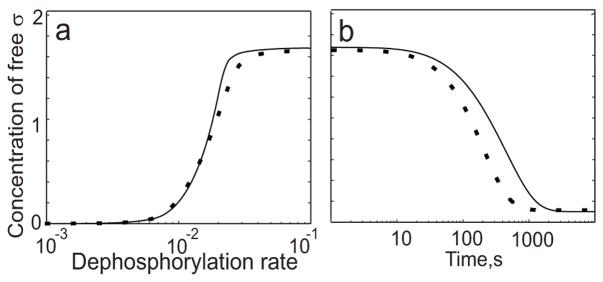
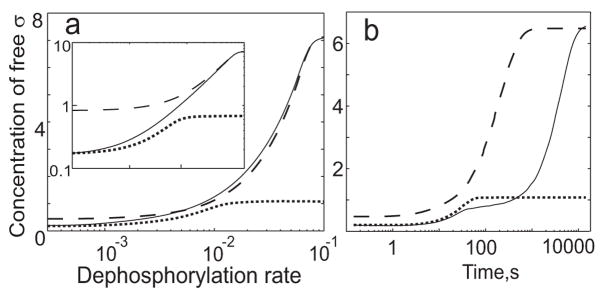
Regulatory networks controlling bacterial gene expression often evolve from common origins and share homologous proteins and similar network motifs. However, when functioning in different physiological contexts, these motifs may be re-arranged with different topologies that significantly affect network performance. Here we analyze two related signaling networks in the bacterium Bacillus subtilis in order to assess the consequences of their different topologies, with the aim of formulating design principles applicable to other systems. These two networks control the activities of the general stress response factor sigma(B) and the first sporulation-specific factor sigma(F). Both networks have at their core a "partner-switching" mechanism, in which an anti-sigma factor forms alternate complexes either with the sigma factor, holding it inactive, or with an anti-anti-sigma factor, thereby freeing sigma. However, clear differences in network structure are apparent: the anti-sigma factor for sigma(F) forms a long-lived, "dead-end" complex with its anti-anti-sigma factor and ADP, whereas the genes encoding sigma(B) and its network partners lie in a sigma(B)-controlled operon, resulting in positive and negative feedback loops. We constructed mathematical models of both networks and examined which features were critical for the performance of each design. The sigma(F) model predicts that the self-enhancing formation of the dead-end complex transforms the network into a largely irreversible hysteretic switch; the simulations reported here also demonstrate that hysteresis and slow turn off kinetics are the only two system properties associated with this complex formation. By contrast, the sigma(B) model predicts that the positive and negative feedback loops produce graded, reversible behavior with high regulatory capacity and fast response time. Our models demonstrate how alterations in network design result in different system properties that correlate with regulatory demands. These design principles agree with the known or suspected roles of similar networks in diverse bacteria.
Figures
Similar articles
-
Signalling network with a bistable hysteretic switch controls developmental activation of the sigma transcription factor in Bacillus subtilis.Mol Microbiol. 2006 Jul;61(1):165-84. doi: 10.1111/j.1365-2958.2006.05212.x. Mol Microbiol. 2006. PMID: 16824103
-
An adenosine nucleotide switch controlling the activity of a cell type-specific transcription factor in B. subtilis.Cell. 1994 Apr 22;77(2):195-205. doi: 10.1016/0092-8674(94)90312-3. Cell. 1994. PMID: 8168129
-
Role of interactions between SpoIIAA and SpoIIAB in regulating cell-specific transcription factor sigma F of Bacillus subtilis.Genes Dev. 1994 Nov 1;8(21):2653-63. doi: 10.1101/gad.8.21.2653. Genes Dev. 1994. PMID: 7958923
-
[Regulation of the phosphorelay at the initiation of sporulation and activation of sporulation-specific sigma factors in Bacillus subtilis].Nihon Saikingaku Zasshi. 1996 Aug;51(3):789-801. doi: 10.3412/jsb.51.789. Nihon Saikingaku Zasshi. 1996. PMID: 8840810 Review. Japanese. No abstract available.
-
Differential gene expression in genetically identical sister cells: the initiation of sporulation in Bacillus subtilis.Mol Microbiol. 2005 May;56(3):578-89. doi: 10.1111/j.1365-2958.2005.04594.x. Mol Microbiol. 2005. PMID: 15819616 Review.
Cited by
-
Regulation of the mazEF toxin-antitoxin module in Staphylococcus aureus and its impact on sigB expression.J Bacteriol. 2009 Apr;191(8):2795-805. doi: 10.1128/JB.01713-08. Epub 2009 Jan 30. J Bacteriol. 2009. PMID: 19181798 Free PMC article.
-
orf4 of the Bacillus cereus sigB gene cluster encodes a general stress-inducible Dps-like bacterioferritin.J Bacteriol. 2009 Jul;191(14):4522-33. doi: 10.1128/JB.00272-09. Epub 2009 May 8. J Bacteriol. 2009. PMID: 19429618 Free PMC article.
-
Modularity in Biological Networks.Front Genet. 2021 Sep 14;12:701331. doi: 10.3389/fgene.2021.701331. eCollection 2021. Front Genet. 2021. PMID: 34594357 Free PMC article. Review.
-
Role of RsbU in controlling SigB activity in Staphylococcus aureus following alkaline stress.J Bacteriol. 2009 Apr;191(8):2561-73. doi: 10.1128/JB.01514-08. Epub 2009 Feb 6. J Bacteriol. 2009. PMID: 19201800 Free PMC article.
-
Interplay of gene expression noise and ultrasensitive dynamics affects bacterial operon organization.PLoS Comput Biol. 2012;8(8):e1002672. doi: 10.1371/journal.pcbi.1002672. Epub 2012 Aug 30. PLoS Comput Biol. 2012. PMID: 22956903 Free PMC article.
References
-
- Wall ME, Hlavacek WS, Savageau MA. Design of gene circuits: lessons from bacteria. Nat Rev Genet. 2004;5:34–42. - PubMed
-
- Lee TI, Rinaldi NJ, Robert F, Odom DT, Bar-Joseph Z, Gerber GK, Hannett NM, Harbison CT, Thompson CM, Simon I, Zeitlinger J, Jennings EG, Murray HL, Gordon DB, Ren B, Wyrick JJ, Tagne JB, Volkert TL, Fraenkel E, Gifford DK, Young RA. Transcriptional regulatory networks in Saccharomyces cerevisiae. Science. 2002;298:799–804. - PubMed
-
- Milo R, Shen-Orr S, Itzkovitz S, Kashtan N, Chklovskii D, Alon U. Network motifs: Simple building blocks of complex networks. Science. 2002;298:824–827. - PubMed
-
- Conant GC, Wagner A. Convergent evolution of gene circuits. Nat Genet. 2003;34:264–266. - PubMed
Publication types
MeSH terms
Substances
Grants and funding
LinkOut - more resources
Full Text Sources
