Review
. 2007;36 Suppl 2(Suppl 2):T142-54.
doi: 10.1016/j.neuroimage.2007.03.029. Epub 2007 Mar 30.

Adaptive decision making and value in the anterior cingulate cortex

Affiliations
Review

Adaptive decision making and value in the anterior cingulate cortex

Mark E Walton et al. Neuroimage. 2007.

Abstract

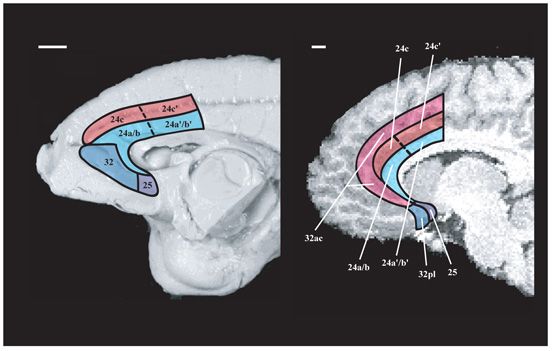
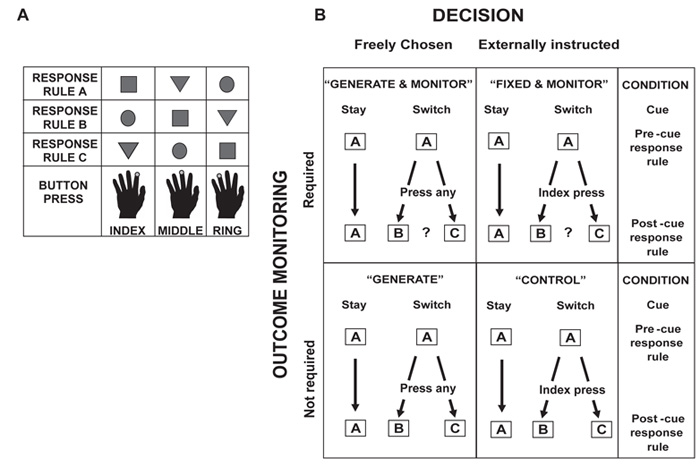
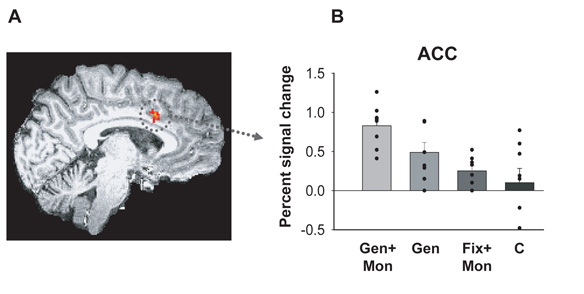
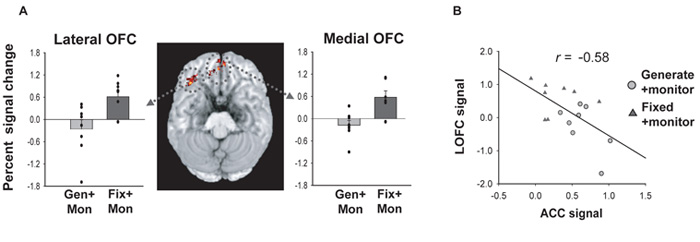
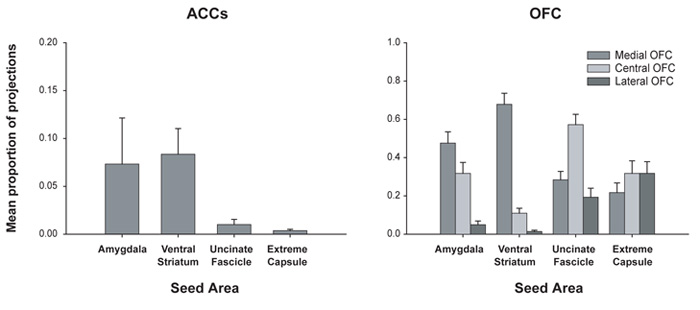
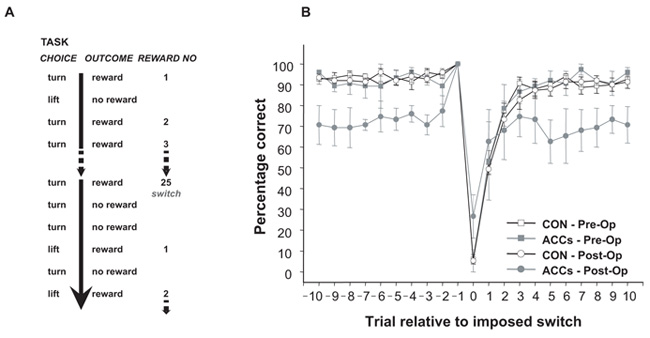
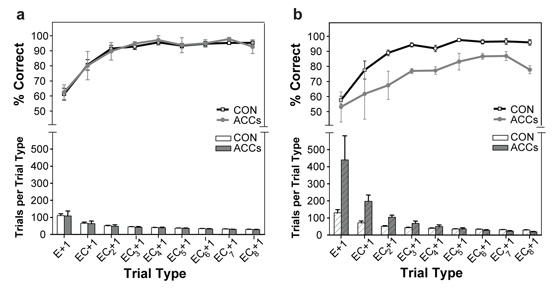
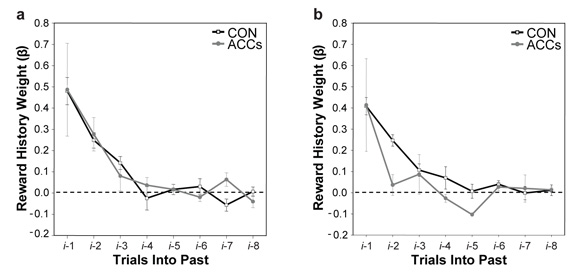
Choosing an appropriate response in an uncertain and varying world is central to adaptive behaviour. The frequent activation of the anterior cingulate cortex (ACC) in a diverse range of tasks has lead to intense interest in and debate over its role in the guidance and control of performance. Here, we consider how this issue can be informed by a series of studies considering the ACC's role in more naturalistic situations where there is no single certain correct response and the relationships between choices and their consequences vary. A neuroimaging study of response switching demonstrates that dorsal ACC is not simply concerned with self-generated responses or error monitoring in isolation, but is instead involved in evaluating the outcome of choices, positive or negative, that have been voluntarily chosen. By contrast, an interconnected part of the orbitofrontal cortex is shown to be more active when attending to consequences of actions instructed by the experimenter. This dissociation is explained with reference to the anatomy of these regions in humans as demonstrated by diffusion weighted imaging. Lesions to a corresponding ACC region in monkeys has no effect on animals' ability to detect or immediately correct errors when response contingencies reverse, but renders them unable to sustain appropriate behaviour due to an impairment in the ability to integrate over time their recent history of choices and outcomes. Taken together, this implies a prominent role for the ACC within a distributed network of regions that determine the dynamic value of actions and guide decision making appropriately.


Figures

Figure 1
Figure 1
Comparative anatomy of primate ACC (macaque monkey, left-hand panel, human, right-hand panel). In the macaque, the ACC is divided into two broad regions: i) ACC gyrus (blue) including area 24a and 24b rostrally, 24a′ and 24b′ caudally, 32, and 25. ii) ACC sulcus (red), area 24c, which occupies most of the sulcal ACC. Its caudal part, 24c′, contains the rostral cingulate motor area (CMAr). It is also possible to consider two broad subdivisions within the human ACC. Human ACC gyrus areas 32pl, 25, 24a and 24b resemble the macaque gyral areas 32, 25, 24a and 24b (Ongur, Ferry and Price, 2003; Vogt, Nimchinsky, Vogt and Hof, 1995). Human areas 24c, 24c′, and 32ac in the ACC sulcus and, when present, the second superior cingulate gyrus (CGs), bear similarities with the areas in the macaque ACC sulcus and include the cingulate motor areas.
Figure 2
Figure 2
A. Representation of the three stimuli and response rules used in the task. B. A schematic of four of the conditions employed. In two of the versions of the task, participants were required after a switch cue to choose their response voluntarily (left-hand column) whereas in the other two they were instructed which response to make (for example, always to make an index finger response: right-hand column). Similarly, in two of the conditions, participants had to attend to the outcome to determine what set of response rules was in place (top row) whereas in the other two the first response was always correct so participants did not need to monitor the feedback in order to switch response rules (bottom row). Adapted from Walton et al. (2004) with permission.
Figure 3
Figure 3
A. ACC activation in the contrast examining the signal at the time of the switch cue compared to at the time of the stay in GENERATE+MONITOR compared to FIXED+MONITOR. B. Plots of the effect size in this ACC region across the four conditions. Signal in the ACC was significantly greater when participants had both to choose a response through their own volition and monitor (GEN+MON) its outcome to decide what to do then when they simply had to select a response voluntarily (GEN) or attend to the feedback of an externally-instructed action (FIX+MON). GEN+MON = GENERATE+MONITOR, GEN = GENERATE, FIX+MON=FIXED+MONITOR, CON = CONTROL. Adapted from Walton et al. (2004) with permission.
Figure 4
Figure 4
A. OFC activation and effect sizes in the contrast examining the signal at the time of the switch cue compared to at the time of the stay in FIXED+MONITOR compared to GENERATE+MONITOR. B. Plot of the signal in the ACC against that in the OFC for the GENERATE+MONITOR and FIXED+MONITOR conditions. There is a significant negative correlation between the two measures and a significant negative mean gradient between the points in each condition paired together for each subject. Adapted from Walton et al. (2004) with permission.
Figure 5
Figure 5
Quantitative results of probabilistic tractography from seed masks in the human extreme capsule, uncinate fascicle, amygdala, and ventral striatum to the ACC sulcus (ACCs – left panel) and to lateral, central and medial OFC (right panel). The probability of connection with each prefrontal region as a proportion of the total connectivity with all prefrontal regions is plotted on the y-axis. Owing to the distorting influence of the high fractional anisotropy of the corpus callosum, the probability of tracts reaching the ACCs may be much lower than the OFC. Although this renders quantitative comparison between different regions problematic, it is still possible to gain important information regarding the pattern of connections within an area. Adapted from Croxson et al. (2005) with permission.
Figure 6
Figure 6
A. Representation of the reward- and error-guided switching task that the monkeys performed. B. Plot of performance on the task centred around the 10 trials before and after an imposed switch (trial 0). The experimental design entailed that switches (point “0”) were only ever imposed after a correct response (point “-1”). The average performance of the control group is depicted by unfilled objects and black lines, the ACCs-lesioned animals by grey objects and lines (squares = pre-operative, circles = post-operative). As is apparent, the performance of control animals on the trial immediately after a switch is poor (point “1”) and there is an increasing likelihood of choosing the correct response on the subsequent trials. By comparison, the ACCs lesion has little effect at the time of the switch, but diverges from the performance of the control animals 4-5 trials after and never subsequently reaches their level of performance. Adapted from Kennerley et al. (2006) with permission.
Figure 7
Figure 7
Pre- (A) and post-operative (B) performance of the control and ACCs-lesioned animals for sustaining rewarded behaviour following an error. The trial types are plotted across the x-axis and start on the left with the trial immediately following an error (E+1). The next data point corresponds to the trial after one error and then a correct response (EC+1), the one after corresponds to the trial after one error and then two correct responses (EC+2), and so on. Moving from the left to the right of each panel corresponds to the animal acquiring more instances of positive reinforcement, after making the correct action, subsequent to an earlier error. Each graph shows the percentage of trials of each type that were correct. Control and ACCS lesion data are shown by the black and grey lines respectively. The histogram in the bottom part of each graph indicates the number of instances of each trial type. White and grey bars indicate the control and ACCS lesion data respectively while hatched bars indicate data from the post-operative session. Adapted from Kennerley et al. (2006) with permission.
Figure 8
Figure 8
Estimates of the influence of previous reward history on current choice in the pre- (A) and post-operative (B) testing periods. Each point represents a regression coefficient value derived from the multiple logistic regression of choice on the current trial (i) against the outcomes (rewarded or unrewarded) on the previous eight trials. The influence of the previous trial (i-1) is shown on the left hand side of each figure, the influence of the previous trial but one (i-2) is shown next, and so on up until the trial that occurred eight trials previously (i-8). Control and ACCs lesion data are shown by the black and grey lines respectively. Adapted from Kennerley et al. (2006) with permission.
Figure 9
Figure 9
A. Schematic of the four possible reward allocations on each trial during the probabilistic conditions of the dynamic matching task. As rewards were assigned independently for each movement, either both, neither, or just one of the two possible responses could result in reward. B. Number of trials required to reach and sustain performance within 97% of the optimal rate during the task. As in previous figures control and ACCSlesion data are shown by white and grey bars respectively. All data come from the post-operative testing period. The optimal rate was defined as ropt=ppqp+q2pq where p and q are the probabilities of a new reward being assigned to the lift or turn responses respectively. Adapted from Kennerley et al. (2006) with permission.

References

    1. Allport DA, Styles E-A, Hsieh S. Shifting intentional set: Exploring the dynamic control of tasks. In: Umilta C, editor. Attention and performance series. The MIT Press; Cambridge, MA, US: 1994.
    1. Amiez C, Joseph JP, Procyk E. Anterior cingulate error-related activity is modulated by predicted reward. Eur J Neurosci. 2005;21:3447–3452. - PMC - PubMed
    1. Amiez C, Joseph JP, Procyk E. Reward encoding in the monkey anterior cingulate cortex. Cereb Cortex. 2006;16:1040–1055. - PMC - PubMed
    1. Aston-Jones G, Cohen JD. An integrative theory of locus coeruleus-norepinephrine function: Adaptive gain and optimal performance. Annu Rev Neurosci. 2005;28:403–450. - PubMed
    1. Balleine BW, Dickinson A. Goal-directed instrumental action: Contingency and incentive learning and their cortical substrates. Neuropharmacology. 1998;37:407–419. - PubMed

Publication types