. 2007 May 11;3(5):e61.
doi: 10.1371/journal.ppat.0030061.

Spatial, temporal, and species variation in prevalence of influenza A viruses in wild migratory birds

Affiliations

Spatial, temporal, and species variation in prevalence of influenza A viruses in wild migratory birds

Vincent J Munster et al. PLoS Pathog. .

Abstract

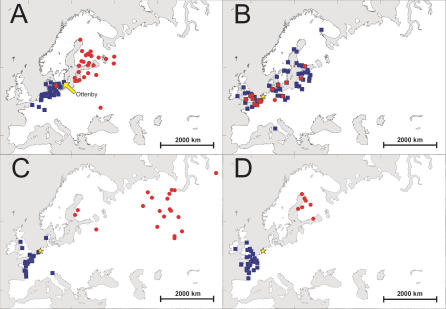
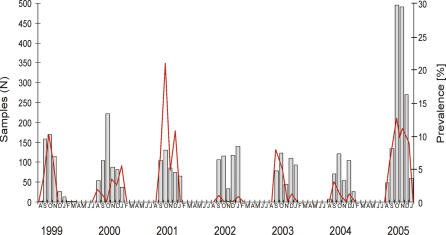
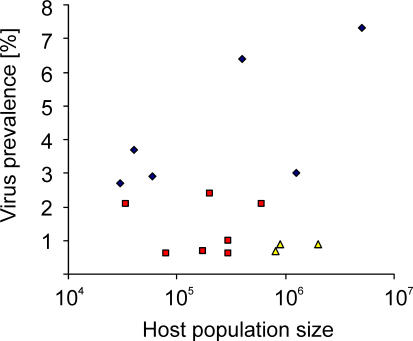
Although extensive data exist on avian influenza in wild birds in North America, limited information is available from elsewhere, including Europe. Here, molecular diagnostic tools were employed for high-throughput surveillance of migratory birds, as an alternative to classical labor-intensive methods of virus isolation in eggs. This study included 36,809 samples from 323 bird species belonging to 18 orders, of which only 25 species of three orders were positive for influenza A virus. Information on species, locations, and timing is provided for all samples tested. Seven previously unknown host species for avian influenza virus were identified: barnacle goose, bean goose, brent goose, pink-footed goose, bewick's swan, common gull, and guillemot. Dabbling ducks were more frequently infected than other ducks and Anseriformes; this distinction was probably related to bird behavior rather than population sizes. Waders did not appear to play a role in the epidemiology of avian influenza in Europe, in contrast to the Americas. The high virus prevalence in ducks in Europe in spring as compared with North America could explain the differences in virus-host ecology between these continents. Most influenza A virus subtypes were detected in ducks, but H13 and H16 subtypes were detected primarily in gulls. Viruses of subtype H6 were more promiscuous in host range than other subtypes. Temporal and spatial variation in influenza virus prevalence in wild birds was observed, with influenza A virus prevalence varying by sampling location; this is probably related to migration patterns from northeast to southwest and a higher prevalence farther north along the flyways. We discuss the ecology and epidemiology of avian influenza A virus in wild birds in relation to host ecology and compare our results with published studies. These data are useful for designing new surveillance programs and are particularly relevant due to increased interest in avian influenza in wild birds.


Conflict of interest statement

Competing interests. The authors have declared that no competing interests exist.

Figures

Figure 1
Figure 1. Summer and Winter Distribution of Different Duck Species Ringed in The Netherlands and Sweden
(A) Recoveries of mallards (Anas platyrhynchos) ringed at Ottenby Bird Observatory, southeast Sweden (yellow arrow), and found in 2002 and 2003 in the period May–August (n = 29, red circles) and November–February (n = 54, blue squares). (B) Ringing sites of mallards (Anas platyrhynchos) found in The Netherlands (yellow star) in 1976–2005 in the periods May–August (n = 61, red circles) and November–February (n = 311, blue squares). (C) Recoveries of wigeons (Anas penelope) ringed in The Netherlands (yellow star) and found in 1998–2005 in the periods May–August (n = 20, red circles) and November–February (n = 38, blue squares). (D) Recoveries of teals (Anas crecca) ringed in the Netherlands (yellow star) and found in 1998–2005 in the periods May–August (n = 7, red circles) and November–February (n = 36, blue squares) [40]. The blue squares represent winter recoveries (November–February) and red circles represent summer recoveries (May–August).
Figure 2
Figure 2. Distribution of HA and NA Subtypes in Influenza A Virus Isolates Obtained from Wild Birds
Data from all 332 virus isolates were included with the distribution of the HA subtypes shown in the top panel and the NA subtypes in the bottom panel.
Figure 3
Figure 3. Annual Influenza A Virus Prevalence in Mallards during Fall Migration in The Netherlands from 1999 to 2005
Bars indicate the number of samples collected per month (left y-axis), and the red line indicates the number of samples positive for influenza A virus by RT-PCR (right y-axis).
Figure 4
Figure 4. Trend Lines for Influenza A Virus Prevalence in Mallards Caught in Sweden and The Netherlands during Fall Migration
The blue line and filled squares (▪) represent the proportion (%) of influenza A virus positive mallards caught and sampled in Sweden between 2002 and 2005 at Ottenby Bird Observatory. The red line and filled diamonds (♦) represent mallards caught at various locations in The Netherlands from 1998 to 2005.
Figure 5
Figure 5. Relation between Influenza A Virus Prevalence in Avian Hosts and Their Population Sizes
Species were categorized in dabbling ducks (blue diamonds; mallard [population 5,000,000; prevalence 7.3%], Eurasian wigeon [1,250,000; 3%], common teal [400,000; 6.4%], northern pintail [60,000; 2.9%], gadwall [30,000; 2.7%], and northern shoveler [40,000; 3.7%]); geese (red squares; white-fronted goose [600,000; 2.1%], barnacle goose [176,000; 0.7%], greylag goose [200,000; 2.4%], brent goose [300,000; 1%], bean goose [80,000; 0.6%], and pink-footed goose [34,000; 2.1%]); and gulls (yellow triangles; black-headed gull [2,000,000, 0.9%], common gull [500,000, 0.9%], and herring gull [800,000, 0.7%]). Virus prevalence in these species was plotted against their respective population sizes [26]. Species are included if >200 samples were tested for influenza A virus. There was no correlation between influenza A virus prevalence and population size, but there was a clustering of data points according to the species categories.

References

    1. Webster RG, Bean WJ, Gorman OT, Chambers TM, Kawaoka Y. Evolution and ecology of influenza A viruses. Microbiol Rev. 1992;56:152–179. - PMC - PubMed
    1. Olsen B, Munster VJ, Wallensten A, Waldenstrom J, Osterhaus AD, et al. Global patterns of influenza a virus in wild birds. Science. 2006;312:384–388. - PubMed
    1. Fouchier RA, Munster V, Wallensten A, Bestebroer TM, Herfst S, et al. Characterization of a novel influenza A virus hemagglutinin subtype (H16) obtained from black-headed gulls. J Virol. 2005;79:2814–2822. - PMC - PubMed
    1. Krauss S, Walker D, Pryor SP, Niles L, Chenghong L, et al. Influenza A viruses of migrating wild aquatic birds in North America. Vector Borne Zoonotic Dis. 2004;4:177–189. - PubMed
    1. Hanson BA, Stallknecht DE, Swayne DE, Lewis LA, Senne DA. Avian influenza viruses in Minnesota ducks during 1998–2000. Avian Dis. 2003;47:867–871. - PubMed

Publication types