. 2007 May 21;177(4):671-81.
doi: 10.1083/jcb.200701144. Epub 2007 May 14.

Myosin-1a powers the sliding of apical membrane along microvillar actin bundles

Affiliations

Myosin-1a powers the sliding of apical membrane along microvillar actin bundles

Russell E McConnell et al. J Cell Biol. .

Abstract

Microvilli are actin-rich membrane protrusions common to a variety of epithelial cell types. Within microvilli of the enterocyte brush border (BB), myosin-1a (Myo1a) forms an ordered ensemble of bridges that link the plasma membrane to the underlying polarized actin bundle. Despite decades of investigation, the function of this unique actomyosin array has remained unclear. Here, we show that addition of ATP to isolated BBs induces a plus end-directed translation of apical membrane along microvillar actin bundles. Upon reaching microvillar tips, membrane is "shed" into solution in the form of small vesicles. Because this movement demonstrates the polarity, velocity, and nucleotide dependence expected for a Myo1a-driven process, and BBs lacking Myo1a fail to undergo membrane translation, we conclude that Myo1a powers this novel form of motility. Thus, in addition to providing a means for amplifying apical surface area, we propose that microvilli function as actomyosin contractile arrays that power the release of BB membrane vesicles into the intestinal lumen.


Figures

Figure 1.
Figure 1.
ATP induces apical membrane redistribution in isolated BBs. (A) Laser scanning confocal sections of isolated BBs (i, iii, and iv) demonstrate the normal overlap of membrane (TRITC-ConA, red) and actin (Alexa488-phalloidin, green). (B) BBs treated with 2 mM ATP and then fixed 5 min later show an accumulation of membrane at microvillar tips (i.e., core bundle plus-ends). In both A and B, cartoons in panel ii show the arrangement of microvillar (MV) actin bundles for the BB in panel i. (C) Pearson correlation coefficients were calculated for the red (membrane) and green (actin) fluorescence images from untreated and ATP-treated BBs. Correlation coefficients are plotted as box plots; solid line within the box corresponds to the median, edges of the box are the 25th and 75th percentiles, and whiskers are the 10th and 90th percentiles. Mean coefficients were 0.81 ± 0.10 (mean ± SD, n = 14) for untreated BBs and 0.08 ± 0.21 (n = 13) for ATP-treated BBs. ATP treatment significantly reduced (*, P < 0.00001) the correlation between these two signals. Bars (A and B), 2.5 μm.
Figure 2.
Figure 2.
Time-lapse analysis of ATP-induced BB membrane redistribution. (A) DIC micrograph of an isolated BB mounted in a flow cell before ATP treatment. Bar, 5 μm. (B) Schematic of the BB in A showing the orientation of microvillar (MV) actin bundles. (C) Time-lapse DIC image series of the same BB in panel A before (t = 0–8 s), during (t = 12–16 s), and after (t = 20–76 s) the addition of 2 mM ATP. Addition of ATP stimulates the translation of membrane toward microvillar tips located at the BB periphery. Membrane vesicles are also seen accumulating in solution surrounding the BB (white arrowheads at 68s). (D) Kymograph generated from a line drawn parallel to the microvillar axis (A, dashed line) shows movement of the BB membrane (y-axis) over time (x-axis); membrane translates away from the BB center (solid line) toward the actin plus-ends at the MV tips (dotted lines).
Figure 3.
Figure 3.
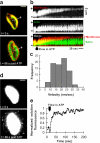
ATP stimulates the plus end–directed translation of membrane over microvillar actin bundles. (A) Spinning disk confocal micrographs of a fluorescently labeled BB (Alexa488-ConA, membrane, red; Alexa546-Phalloidin, actin, green) before (t = 0 s) and after (t = 88s) addition of 2 mM ATP; the accumulation of membrane at microvillar tips can clearly be observed after ATP addition. (B) Kymographs drawn from the white dashed line over the BB in panel A reveal that membrane (red) moves toward the microvillar tips as the actin bundle length (green) remains constant. (C) Histogram of membrane translation velocities derived from 79 kymographs of 42 BBs; mean velocity equals 19.2 ± 6.1 nm/s (mean ± SD). (D) Contrast enhancement of the membrane (red) channel in panel A reveals an accumulation of small membrane vesicles in solution around the BB after ATP treatment. (E) Quantification of integrated fluorescence in solution surrounding the BB shows a release of membrane that begins immediately after the addition of 2 mM ATP. Bars (A and D), 5 μm.
Figure 4.
Figure 4.
Ultrastructural analysis of BB membrane shedding. (A) TEM analysis of an isolated BB shows that the apical membrane covers the majority of the core actin bundles, leaving only a small fraction of their length exposed at bundle minus-ends (region highlighted in red). (B) BB from the same preparation as in panel A after treatment with 2 mM ATP. In addition to extensive vesiculation at microvillar tips, a significantly greater length of individual actin bundles appear to be exposed (i.e., membrane free) at the bundle minus-ends (compare red regions in A and B). (C) Higher magnification view of boxed area in panel B clearly shows vesiculation at the tips of nearly all microvilli. (D) Vesicles shed from tips exhibit a diameter comparable to the microvillus and show no evidence of actin bundle fragments at their core. Bars: (A and B) 2 μm; (C) 0.5 μm; (D) 0.1 μm.
Figure 5.
Figure 5.
Characterization of vesicles released from the BB upon ATP treatment. (A) BB samples in the presence or absence of ATP were fractionated using differential centrifugation and then separated using SDS-PAGE. Western blots show that apical membrane markers, SI and AP, undergo ATP-induced redistribution from the low speed (5,000 g) pellet (P) into the low speed supernatant (S). Ultraspeed centrifugation (100,000 g) of the 5,000-g S fraction reveals that both membrane markers sediment, indicating membrane association. Although Myo1a is also released from the BB in the presence of ATP, a significant amount of Myo1a sediments with membrane markers in the 100,000-g P fraction. (B) TEM of the negatively stained 5,000-g S fraction shows that ATP induces the release of copious amounts of membrane material. (C) TEM of negatively stained 100,000-g P fraction confirms the presence of small vesicles similar in appearance to those observed in micrographs of isolated BBs. Bars: (B) 2 μm; (C) 0.5 μm.
Figure 6.
Figure 6.
Quantitative assay for BB membrane shedding. (A) Schematic of the assay used to quantify the extent of BB membrane shedding under various conditions. BBs are labeled with AM1-43, reacted with 2 mM ATP, centrifuged to isolate the shed membrane (5,000-g supernatant), and the amount fluorescent material is measured in a microplate reader. (B) Laser scanning confocal micrograph of phalloidin-labeled (green) isolated BBs shows that AM1-43 (red) evenly labels the BB membrane. Bars, 4 μm. (C) Increasing concentrations of BBs were treated with 2 mM ATP and the amount of membrane shed from each sample was measured using the microplate assay. ATP-induced membrane shedding scales with the BB concentration, demonstrating a linear response over two orders of magnitude. Points on this plot represent mean ± SD calculated from replicates at each BB concentration (for all values, SD is smaller than the point size).
Figure 7.
Figure 7.
Nucleotide and myosin dependence of BB membrane shedding. (A) 20 μg/ml BBs were treated with 2 mM of ATP, adenosine diphosphate (ADP), pyrophosphate (PPi), adenosine 5′-[γ-thio] triphosphate (ATPγS), or adenosine 5′-[β,γ-imido] triphosphate (AMP-PNP), and membrane shedding was quantified using the MSA. ATP strongly stimulated membrane shedding, while ADP and PPi had essentially no effect, and the nonhydrolysable ATP analogues ATPγS and AMP-PNP evoked only minor responses. (B) Membrane shedding exhibits Michaelis-Menten kinetics with respect to ATP concentration (closed circles, solid line shows curve fit; VMax = 1.2 ± 0.1 mM, KM = 396 ± 103 μM). In the presence of 2 mM ADP (open circles, dashed line shows curve fit; VMax = 1.1 ± 0.1 mM, KM = 1,869 ± 437 μM), membrane shedding is inhibited. Inset shows the double-reciprocal plot of the same data. (C) Incubating BBs with 50 μM Blebbistatin, a potent Myo2 inhibitor, has no effect on membrane shedding as measured in the MSA. (D) TEM analysis of BBs incubated with 50 μM Blebbistatin and 2 mM ATP (i–iii) shows that the junctional contraction associated with Myo2 activity is absent, as indicated by the parallel orientation of microvillar actin bundles in these BBs (compare with Fig. 4 B). However, the robust vesiculation at microvillar tips appears unaffected by Blebbistatin. (E) Coomassie blue (C.B.)–stained gel of WT and Myo1a KO BB fractions and associated anti-Myo1a Western blot (W.B.) confirms the absence of Myo1a in KO samples. (F) ATP-induced membrane shedding measured for equal quantities (5 μg) of WT and Myo1a KO BBs. KO BBs exhibit ∼5% of the shedding activity seen in WT BBs. (G) The fluorescence signals measured from equal amounts (5 μg) of WT and Myo1a KO BBs show equivalent labeling by AM1-43. (H) BB membranes were fluorescently labeled with Alexa488-ConA, treated with 2 mM ATP, and imaged for 3 min. Time-lapse images show that the WT BB exhibits a robust loss of membrane, yet the KO BB membrane structure remains essentially unchanged during this time course. For the values plotted in A–C, each point represents the mean ± SD calculated from at least three different BB preparations. The values plotted in F and G represent mean ± SD calculated from replicates of the same BB preparation, but are representative of five individual paired WT and KO BB preparations. Bars: 0.5 μm (di, ii); 2 μm (diii, h). *, P < 0.05.
Figure 8.
Figure 8.
BB membrane shedding model. (A) In isolated BBs, Myo1a motor activity powers the translation of apical membrane toward the actin bundle plus-end at the microvillus tip. Upon reaching the tip, membrane vesiculates and is shed from the BB. (B) In the context of an intact enterocyte, Myo1a-powered membrane translation may underlie the regulated turnover of BB membrane. New membrane is continually delivered to the terminal web, while older membrane is translated along microvillar actin bundles and eventually released from tips, into the intestinal lumen.

Similar articles

Cited by

References

    1. Beaun, A.R., and G. Grondin. 1991. Shedding of vesicular material from the cell surface of eukaryotic cells: different cellular phenomena. Biochim. Biophys. Acta. 1071:203–219. - PubMed
    1. Belyantseva, I.A., E.T. Boger, and T.B. Friedman. 2003. Myosin XVa localizes to the tips of inner ear sensory cell stereocilia and is essential for staircase formation of the hair bundle. Proc. Natl. Acad. Sci. USA. 100:13958–13963. - PMC - PubMed
    1. Berg, J.S., and R.E. Cheney. 2002. Myosin-X is an unconventional myosin that undergoes intrafilopodial motility. Nat. Cell Biol. 4:246–250. - PubMed
    1. Black, B.L., Y. Yoneyama, and F. Moog. 1980. Microvillous membrane vesicle accumulation in media during culture of intestine of chick embryo. Biochim. Biophys. Acta. 601:343–348. - PubMed
    1. Bretscher, A. 1991. Microfilament structure and function in the cortical cytoskeleton. Annu. Rev. Cell Biol. 7:337–374. - PubMed

Publication types