

IL1-receptor accessory protein-like 1 (IL1RAPL1), a protein involved in cognitive functions, regulates N-type Ca2+-channel and neurite elongation
- PMID: 17502602
- PMCID: PMC1885628
- DOI: 10.1073/pnas.0701133104
IL1-receptor accessory protein-like 1 (IL1RAPL1), a protein involved in cognitive functions, regulates N-type Ca2+-channel and neurite elongation
Abstract
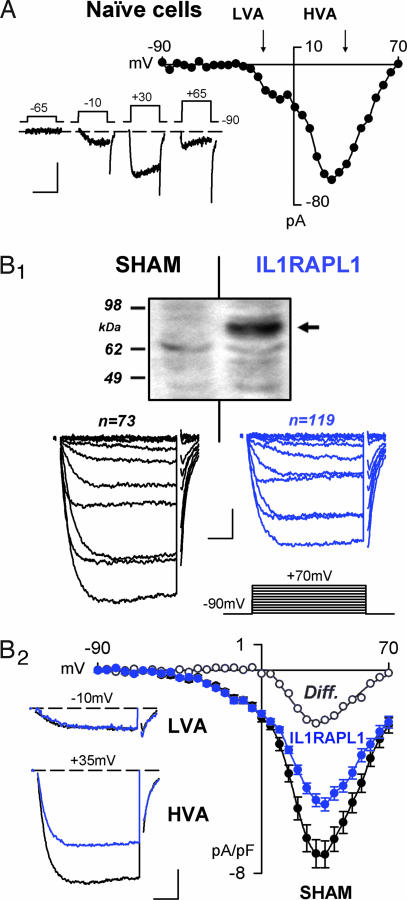
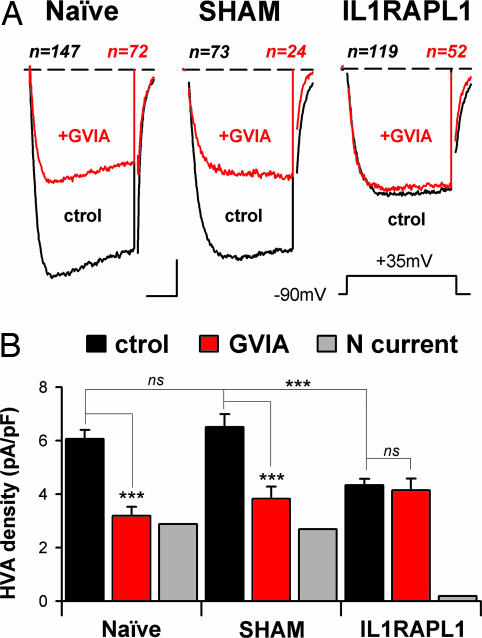
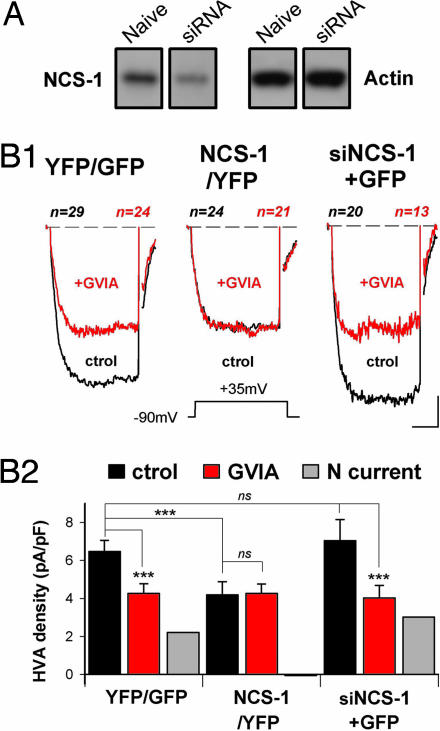
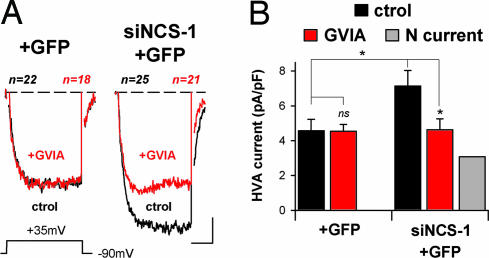
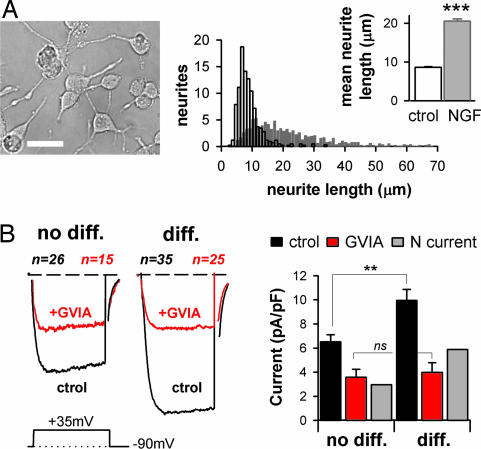
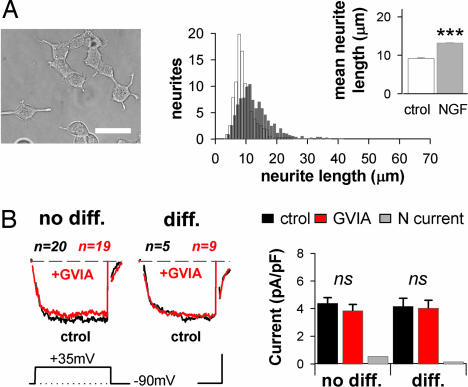
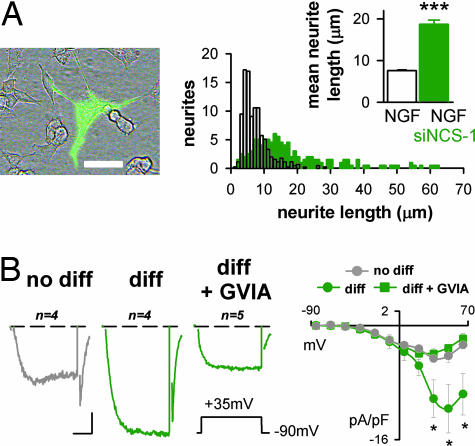
Null mutations in the IL1-receptor accessory protein-like 1 gene (IL1RAPL1) are responsible for an inherited X-linked form of cognitive impairment. IL1RAPL1 protein physically interacts with neuronal calcium sensor-1 (NCS-1), but the functional impact of the IL1RAPL1/NCS-1 interaction remains unknown. Here, we demonstrate that stable expression of IL1RAPL1 in PC12 cells induces a specific silencing of N-type voltage-gated calcium channels (N-VGCC) activity that explains a secretion deficit observed in these IL1RAPL1 cells. Importantly, this modulation of VGCC activity is mediated by NCS-1. Indeed, a specific loss-of-function of N-VGCC was observed in PC12 cells overexpressing NCS-1, and a total recovery of N-VGCC activity was obtained by a down-regulation of NCS-1 in IL1RAPL1 cells. The functional relevance of the interaction between IL1RAPL1 and NCS-1 was also suggested by the reduction of neurite elongation observed in nerve growth factor (NGF)-treated IL1RAPL1 cells, a phenotype rescued by NCS-1 inactivation. Because both proteins are highly expressed in neurons, these results suggest that IL1RAPL1-related mental retardation could result from a disruption of N-VGCC and/or NCS-1-dependent synaptic and neuronal activities.
Conflict of interest statement
The authors declare no conflict of interest.
Figures
Similar articles
-
A postsynaptic signaling pathway that may account for the cognitive defect due to IL1RAPL1 mutation.Curr Biol. 2010 Jan 26;20(2):103-15. doi: 10.1016/j.cub.2009.12.030. Epub 2010 Jan 21. Curr Biol. 2010. PMID: 20096586
-
Structural and functional deficits in a neuronal calcium sensor-1 mutant identified in a case of autistic spectrum disorder.PLoS One. 2010 May 7;5(5):e10534. doi: 10.1371/journal.pone.0010534. PLoS One. 2010. PMID: 20479890 Free PMC article.
-
Modulation of muscarinic signaling in PC12 cells overexpressing neuronal Ca2+ sensor-1 protein.Cell Mol Biol (Noisy-le-grand). 2009 Aug 5;55 Suppl:OL1138-50. Cell Mol Biol (Noisy-le-grand). 2009. PMID: 19656467
-
The Synaptic and Neuronal Functions of the X-Linked Intellectual Disability Protein Interleukin-1 Receptor Accessory Protein Like 1 (IL1RAPL1).Dev Neurobiol. 2019 Jan;79(1):85-95. doi: 10.1002/dneu.22657. Epub 2018 Dec 21. Dev Neurobiol. 2019. PMID: 30548231 Review.
-
Neuronal calcium sensor-1 regulation of calcium channels, secretion, and neuronal outgrowth.Cell Mol Neurobiol. 2010 Nov;30(8):1283-92. doi: 10.1007/s10571-010-9588-7. Epub 2010 Nov 23. Cell Mol Neurobiol. 2010. PMID: 21104311 Free PMC article. Review.
Cited by
-
Calcium dysregulation and neuroinflammation: discrete and integrated mechanisms for age-related synaptic dysfunction.Ageing Res Rev. 2013 Sep;12(4):982-95. doi: 10.1016/j.arr.2013.05.008. Epub 2013 Jun 8. Ageing Res Rev. 2013. PMID: 23751484 Free PMC article. Review.
-
The X-linked intellectual disability protein IL1RAPL1 regulates excitatory synapse formation by binding PTPδ and RhoGAP2.Hum Mol Genet. 2011 Dec 15;20(24):4797-809. doi: 10.1093/hmg/ddr418. Epub 2011 Sep 17. Hum Mol Genet. 2011. PMID: 21926414 Free PMC article.
-
Humoral sleep regulation; interleukin-1 and tumor necrosis factor.Vitam Horm. 2012;89:241-57. doi: 10.1016/B978-0-12-394623-2.00013-5. Vitam Horm. 2012. PMID: 22640617 Free PMC article. Review.
-
NCS-1 is a regulator of calcium signaling in health and disease.Biochim Biophys Acta Mol Cell Res. 2018 Nov;1865(11 Pt B):1660-1667. doi: 10.1016/j.bbamcr.2018.05.005. Epub 2018 May 8. Biochim Biophys Acta Mol Cell Res. 2018. PMID: 29746899 Free PMC article. Review.
-
Sense and specificity in neuronal calcium signalling.Biochim Biophys Acta. 2015 Sep;1853(9):1921-32. doi: 10.1016/j.bbamcr.2014.10.029. Epub 2014 Nov 4. Biochim Biophys Acta. 2015. PMID: 25447549 Free PMC article. Review.
References
-
- Ropers HH, Hamel BCJ. Nat Rev Genet. 2005;6:42–57. - PubMed
-
- Chelly J, Khelfaoui M, Francis F, Cherif B, Bienvenu T. Eur J Hum Genet. 2006;14:701–713. - PubMed
-
- Carrie A, Jun L, Bienvenu T, Vinet MC, McDonell N, Couvert P, Zemni R, Cardona A, Van Buggenhout G, Frints S, et al. Nat Genet. 1999;23:25–31. - PubMed
-
- Bahi N, Friocourt G, Carrie A, Graham ME, Weiss JL, Chafey P, Fauchereau F, Burgoyne RD, Chelly J. Hum Mol Genet. 2003;12:1415–1425. - PubMed
-
- Martone ME, Edelman VM, Ellisman MH, Nef P. Cell Tissue Res. 1999;295:395–407. - PubMed
Publication types
MeSH terms
Substances
LinkOut - more resources
Full Text Sources
Molecular Biology Databases
Miscellaneous
