. 2007 May 22;104(21):8737-42.
doi: 10.1073/pnas.0701829104. Epub 2007 May 14.

In vitro erythropoiesis from bone marrow-derived progenitors provides a physiological assay for toxic and mutagenic compounds

Affiliations

In vitro erythropoiesis from bone marrow-derived progenitors provides a physiological assay for toxic and mutagenic compounds

J Shuga et al. Proc Natl Acad Sci U S A. .

Abstract

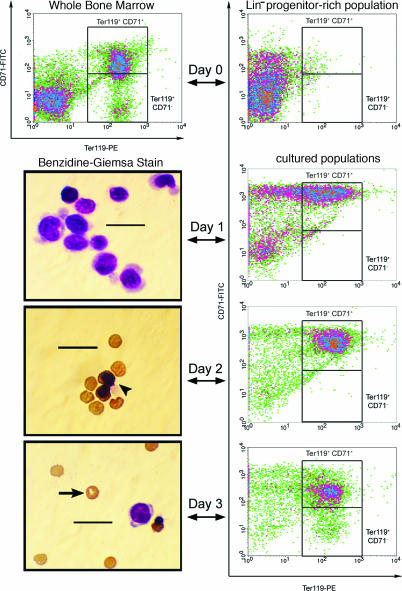
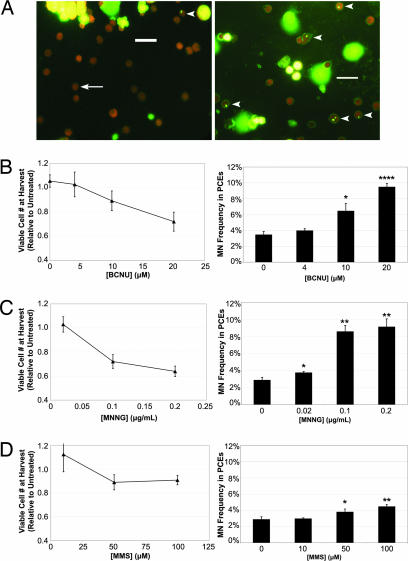
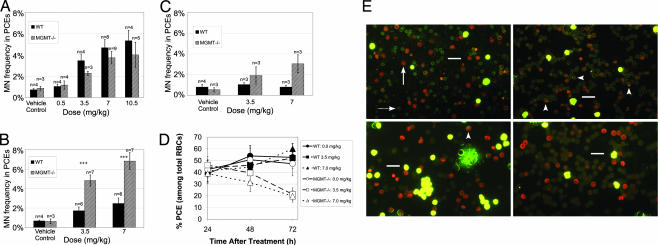
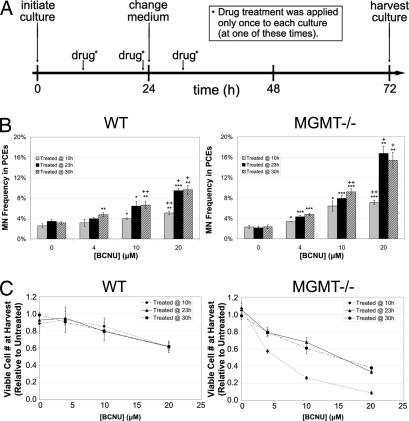
The goal of this study was to create an in vitro cell culture system that captures essential features of the in vivo erythroid micronucleus (MN) genotoxicity assay, thus enabling increased throughput and controlled studies of the hematopoietic DNA damage response. We show that adult bone marrow (BM) cultures respond to erythropoietin, the principal hormone that stimulates erythropoiesis, with physiological erythropoietic proliferation, differentiation, and enucleation. We then show that this in vitro erythropoietic system clearly signals exposure to genotoxicants through erythroid MN formation. Furthermore, we determined that DNA repair-deficient (MGMT(-/-)) BM displayed sensitivity to genotoxic exposure in vivo compared with WT BM and that this phenotypic response was reflected in erythropoietic cultures. These findings suggest that this in vitro erythroid MN assay is capable of screening for genotoxicity on BM in a physiologically reflective manner. Finally, responses to genotoxicants during erythroid differentiation varied with exposure time, demonstrating that this system can be used to study the effect of DNA damage at specific developmental stages.


Conflict of interest statement

The authors declare no conflict of interest.

Figures

Fig. 1.
Fig. 1.
Terminal erythropoiesis stimulated in Lin BM cells over 3 days in culture. BM cells were stained with biotinylated α-Lin mAbs, and the Lin+ fraction of the population was subsequently removed to obtain a progenitor-rich population (Lin BM). These Lin cells were then cultured in vitro for 3 days on fibronectin-coated plates in medium containing serum. Epo was included in the medium for the first day of culture, and then the medium was changed, and Epo was removed. The differentiation profile of the cultured cells was examined by both flow cytometry and benzidine–Giemsa stain after each day in culture, and a representative micrograph of these stained populations is presented from each day of erythropoieitc culture. After the third day of culture, flow cytometry indicated that the majority of the resulting population had acquired a late erythroid surface phenotype (Ter-119+). Furthermore, benizidine–Giemsa staining revealed that many cells in the harvested population had enucleated and expressed hemoglobin. The arrowhead indicates a hemoglobin+ normoblast, and the arrow indicates an enucleated reticulocyte. (Scale bars, 20 μm.)
Fig. 2.
Fig. 2.
Detection of genotoxicity through in vitro erythropoiesis. Purified Lin cells were cultured in vitro for 1 day on fibronectin-coated plates in medium containing serum, Epo, SCF, dexamethasone, and IGF1. Genotoxic alkylating agents were introduced into the culture media 23 h after seeding. One hour later, the media were changed, and all soluble growth factors and alkylating agents were removed. Populations were then cultured for 2 additional days in media with serum. At harvest, the cells were removed from culture, and genotoxic effects were quantified through viable cell counts and differential cell counts. (A) Representative micrographs are provided from both treated (Right) and untreated (Left) cultures. The arrow indicates a normally enucleated PCE, and the arrowheads indicate micronucleated PCEs. (Scale bars, 20 μm.) (B) The response of this culture system to BCNU treatment is quantified in terms of relative viable cell numbers and MN frequencies. On the left, relative viable cell numbers are plotted vs. BCNU concentration. On the right, MN frequency is plotted vs. BCNU concentration. (C) The response of this culture system to MNNG treatment is quantified in terms of relative viable cell numbers and MN frequencies. (D) The response of this culture system to MMS treatment is quantified in terms of relative viable cell numbers and MN frequencies. Data are presented as the mean of three independent cultures ±SD. ∗ indicates a significant difference (P < 0.05) from untreated control cultures. ∗∗ indicates a significant difference (P < 0.01) from the untreated control cultures. ∗∗∗∗ indicates a significant difference (P < 0.0001) from the untreated control cultures.
Fig. 3.
Fig. 3.
MGMT−/− mice exhibit sensitivity to MN formation after in vivo exposure to BCNU: dynamic quantification of the frequency of PCEs and micronucleated PCEs in BM. WT and MGMT−/− male mice aged 6–8 weeks were treated with either BCNU or vehicle control (PBS/10% EtOH) by i.p. injection. After 24, 48, or 72 h, the treated animals were killed, the BM was flushed from the femurs, and slides were prepared and stained with acridine orange for differential cell counting. Data are presented as the mean ±SD. (A) The MN frequency in BM PCEs was quantified 24 h after exposure to BCNU. (B) The MN frequency in BM PCEs was quantified 48 h after exposure to BCNU. +++ indicates a significant difference (P < 0.001) from WT mice. (C) The MN frequency in BM PCEs was quantified 72 h after exposure to BCNU. (D) The PCE frequency in total BM RBCs was quantified at various times after exposure to BCNU. At 48 h after exposure to BCNU, the BM of MGMT−/− mice was found to contain a reduced frequency of PCEs, and 72 h after exposure, this effect had become even more pronounced. (E) Representative micrographs are shown for BM from the two genotypes examined at various times after treatment with either BCNU (3.5 mg/kg) or vehicle control. The top left micrograph (WT mice 48 h after treatment with vehicle control) is characteristic of untreated, WT BM, with a PCE/RBC ratio between 40% and 60% and a low MN frequency. The arrow indicates a PCE, and the dashed arrow indicates an NCE. The bottom left micrograph is representative of WT BM 48 h after treatment with BCNU (3.5 mg/kg), which has largely recovered to resemble untreated BM (the top left micrograph). The arrowhead indicates a micronucleated PCE. The top right micrograph represents MGMT−/− BM 48 h after treatment with BCNU, which contains an elevated MN frequency among PCEs and a reduced PCE/RBC frequency. The bottom right micrograph illustrates that the decreased PCE/RBC ratio becomes even more pronounced in MGMT−/− BM 72 h after treatment with BCNU. (Scale bars, 20 μm.)
Fig. 4.
Fig. 4.
Similar to in vivo responses, Lin BM from MGMT−/− mice exhibits sensitivity to MN formation and decreased PCE yields when treated with BCNU during erythropoietic culture. (A) Purified Lin cells from MGMT−/− and WT mice were cultured in vitro for 1 day on fibronectin-coated plates in medium containing serum, Epo, SCF, dexamethasone, and IGF1. After 1 day, the medium was changed to one containing serum without other hormones. Populations were then cultured for 2 additional days before harvest at 72 h. BCNU was introduced into the culture media at various times (10, 23, or 30 h) after seeding. At harvest, the cells were removed from culture, and genotoxic effects were quantified through viable cell counts and MN enumeration. (B) The MN response of Lin bone marrow from WT and MGMT−/− mice to BCNU in this erythropoietic culture system is quantified. MN frequency is plotted vs. BCNU concentration, and data are presented as the mean of three independent cultures ±SD. + indicates a significant difference (P < 0.05) between WT and MGMT−/− cultures. ++ indicates a significant difference (P < 0.01) between WT and MGMT−/− cultures. ∗ indicates a significant difference (P < 0.05) from the vehicle control. ∗∗ indicates a significant difference (P < 0.01) from the vehicle control. ∗∗∗ indicates a significant difference (P < 0.001) from the vehicle control. (C) The effect of BCNU exposure on the viable cell number of Lin bone marrow from WT and MGMT−/− mice after erythropoietic culture is quantified. Relative viable cell number is plotted vs. BCNU concentration, and data are presented as the mean of three independent cultures ±SD.

References

    1. Zon LI. Hematopoiesis. New York: Oxford Univ Press; 2001.
    1. Lodish HF. Molecular Cell Biology. New York: Freeman; 2003.
    1. Heddle JA, Cimino MC, Hayashi M, Romagna F, Shelby MD, Tucker JD, Vanparys P, MacGregor JT. Environ Mol Mutagen. 1991;18:277–291. - PubMed
    1. Roth RB, Samson LD. Mutat Res. 2000;462:107–120. - PubMed
    1. Cai S, Hartwell JR, Cooper RJ, Juliar BE, Kreklau E, Abonour R, Goebel WS, Pollok KE. Mol Ther. 2006;13:1016–1026. - PubMed

Publication types

MeSH terms