Comparative Study
. 2007 Jun 11;204(6):1359-69.
doi: 10.1084/jem.20062545. Epub 2007 May 14.

Selective blockade of the inhibitory Fcgamma receptor (FcgammaRIIB) in human dendritic cells and monocytes induces a type I interferon response program

Affiliations
Comparative Study

Selective blockade of the inhibitory Fcgamma receptor (FcgammaRIIB) in human dendritic cells and monocytes induces a type I interferon response program

Kavita M Dhodapkar et al. J Exp Med. .

Erratum in

  • J Exp Med. 2007 Oct;204(10):2489

Abstract

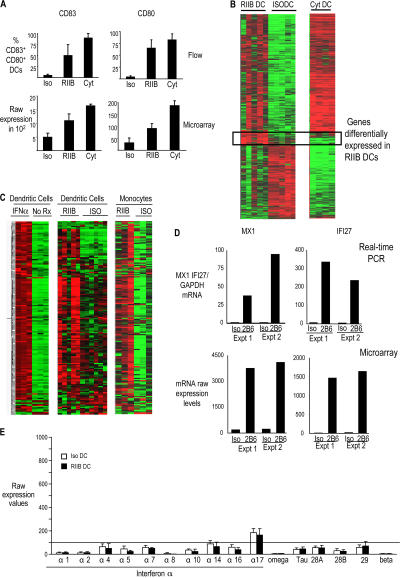
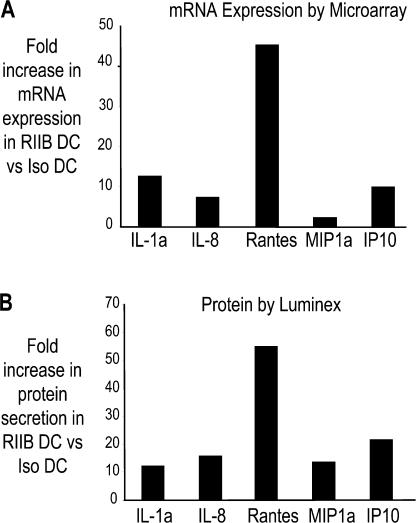
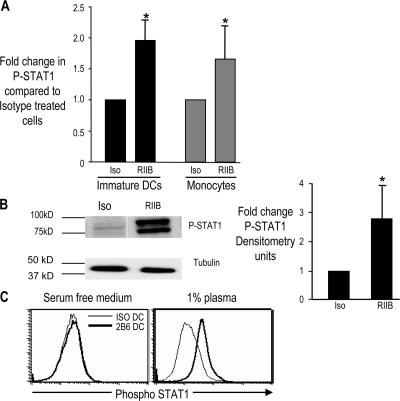
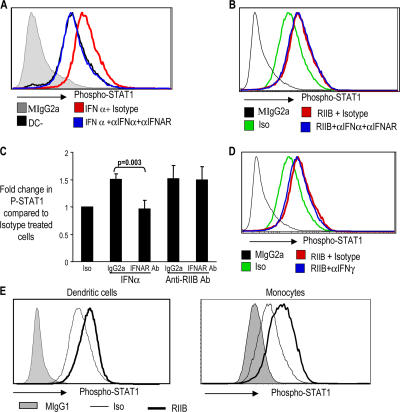
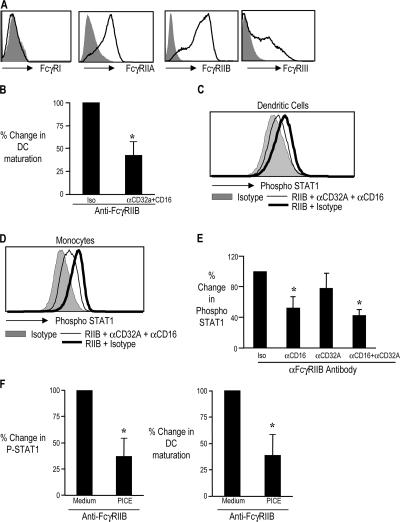
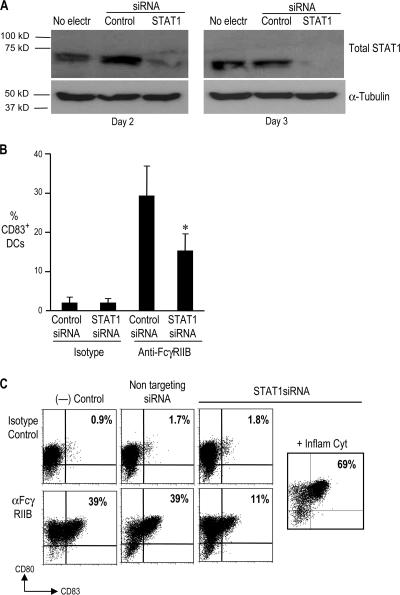
The ability of dendritic cells (DCs) to activate immunity is linked to their maturation status. In prior studies, we have shown that selective antibody-mediated blockade of inhibitory FcgammaRIIB receptor on human DCs in the presence of activating immunoglobulin (Ig) ligands leads to DC maturation and enhanced immunity to antibody-coated tumor cells. We show that Fcgamma receptor (FcgammaR)-mediated activation of human monocytes and monocyte-derived DCs is associated with a distinct gene expression pattern, including several inflammation-associated chemokines, as well as type 1 interferon (IFN) response genes, including the activation of signal transducer and activator of transcription 1 (STAT1). FcgammaR-mediated STAT1 activation is rapid and requires activating FcgammaRs. However, this IFN response is observed without a detectable increase in the expression of type I IFNs themselves or the need to add exogenous IFNs. Induction of IFN response genes plays an important role in FcgammaR-mediated effects on DCs, as suppression of STAT1 by RNA interference inhibited FcgammaR-mediated DC maturation. These data suggest that the balance of activating/inhibitory FcgammaRs may regulate IFN signaling in myeloid cells. Manipulation of FcgammaR balance on DCs and monocytes may provide a novel approach to regulating IFN-mediated pathways in autoimmunity and human cancer.


Figures

Figure 1.
Figure 1.
Changes in GEPs of human DCs treated for 24 h with isotype control antibody, anti-FcγRIIB antibody, or an inflammatory cytokine cocktail. (A) Validation of microarray. Immature monocyte–derived DCs from healthy donors (n = 4) were treated with 20 μg/ml mouse IgG1 (Iso), 20 μg/ml anti-FcγRIIB blocking antibody (RIIB), or inflammatory cytokine cocktail (IL-1β, TNF-β, PGE2, and IL-6; Cyt). 24 h later, some DCs from each of the three conditions were analyzed for the expression of DC maturation markers (CD83 and CD80) by flow cytometry. RNA was extracted from the rest of the DCs and gene expression was examined using Human Genome U133 Plus 2 Affymetrix chips. These graphs show the changes in the expression of DC maturation markers (CD80 and CD83) at the level of mRNA (by microarray) and protein (by flow cytometry). (B) Heatmap of 1,801 genes differentially expressed between Iso DC and RIIB DC. Day 5 immature Mo-DCs were treated with either 20 μg/ml mouse IgG1 (Iso DC), 20 μg/ml anti-FcγRIIB antibody (RIIB DC), or inflammatory cytokine cocktail (IL-1β, TNF-β, PGE2, and IL-6; Cyt DC). 24 h later, the DCs were harvested and RNA was extracted and analyzed using the Human Genome U133 Plus 2 Affymetrix gene array chips and the GeneSpring software. Genes that were marked as present and expressed above a raw level of 100 were included in the analysis. Iso DC, RIIB DC, and Cyt DC were analyzed to detect genes that were differentially expressed between the three groups using a parametric test with variance assumed equal (ANOVA) with a p-value cut off of 0.05, followed by the Benjamin and Hochberg false discovery rate multiple correction. 4,759 genes were found to be differentially expressed between Iso DC, RIIB DC, and Cyt DC. Of these 4,759 genes, 1,801 genes were found to be differentially expressed in RIIB DCs compared with Iso DCs (twofold difference; P < 0.05). (left) The expression of these 1,801 genes in RIIB DC and Iso DC. (right) The expression of the same 1,801 genes in DCs treated with inflammatory cytokines (Cyt DC). The box shows a subset of 95 genes that are overexpressed only in RIIB DCs compared with both Iso DCs and Cyt DCs. Details of these genes are noted in Table S1. (C) Heat map of IRGs in monocytes and DCs treated with anti-FcγRIIB antibody or isotype control antibody. Day 5 monocyte derived IDCs (n = 3) were treated with IFN-α2b (1,000 U/ml) or left untreated. 24 h later, RNA was extracted and analyzed using the Human Genome U133 Plus2 Affymetrix chips and the GeneSpring software (version 7.2). 167 genes were found to be up-regulated by more than fivefold in IFN-treated DCs compared with untreated DCs. (left) Expression of the 167 IFN-α–induced genes in DCs treated with IFN-α and untreated DCs (No Rx). Expression of the 167 IRGs was then compared in DCs (n = 5) and monocytes (n = 3) treated with anti-FcγRIIB mAb (RIIB) or isotype control antibody (Iso). (D) Expression of two IFN-induced genes (Mx1 and IFI27) in DCs treated with anti-FcγRIIB mAb or isotype control was analyzed by TaqMan, and expression data was compared with the data obtained by microarray analysis. RNA from two donors (used in the microarray analysis) was analyzed by TaqMan to verify the expression of two IFN-induced genes (Mx1 and IFI27). The figure shows the Taqman expression data compared with the expression data obtained by microarray analysis. (E) Expression of type I IFNs by microarray. Gene expression data obtained from DCs treated with either isotype antibody or anti-FcγRIIB antibody, as in Fig. 1 B, was analyzed for the expression of type I IFN genes. The histogram shows the mean ± the SD for the mRNA expression from four different donors. Table S1 is available at http://www.jem.org/cgi/content/full/jem.20062545/DC1.
Figure 2.
Figure 2.
Up-regulation of chemokines/cytokines in FcγR-matured DCs. Validation of microarray data at the protein level. Monocyte-derived IDCs (four different donors) were treated with 20 μg/ml anti-FcγRIIB antibody (RIIB DC) or 20 μg/ml isotype control antibody (mouse IgG1; Iso DC). 24 h later, DCs were harvested and RNA was extracted and analyzed using the U133 Plus2 Affymetrix chips (as in Fig. 1). The culture supernatant was analyzed for the expression of cytokines/chemokines by Luminex analysis. The graphs show the fold increase in mRNA expression (A) or protein secretion (B) for the cytokines and chemokines in RIIB DC compared with Iso DC.
Figure 3.
Figure 3.
Mechanism of FcγR-mediated induction of IFN response. (A) Up-regulation of P-STAT1 in DCs or monocytes treated with anti-FcγRIIB mAb versus isotype control. Immature Mo-DCs (n = 8) or freshly isolated monocytes (n = 7) were treated with anti-FcγRIIB antibody (RIIB) or isotype control antibody (Iso). 24 h later, P-STAT1 expression was examined by flow cytometry. The histogram shows fold change in expression of P-STAT1 in anti-FcγRIIB antibody–treated versus isotype control antibody–treated cells. *, P < 0.05. (B) Western blot confirmation of up-regulation of phosphorylated STAT1 in DCs treated with anti-FcγRIIB antibody versus isotype control antibody. Monocyte-derived IDCs were treated with isotype control mouse IgG1 antibody (Iso) or anti-FcγRIIB antibody (RIIB). 24 h later, the DCs were harvested and the protein was analyzed on a 7.5% polyacrylamide gel to detect the presence of phosphorylated STAT1. (left) Representative of four separate experiments. (right) The summary of data for quantitative densitometry. Value for P-STAT1 was first normalized against data for α-tubulin in that sample, before comparison between RIIB DCs and Iso DCs. Data shown are the summary of four separate experiments. *, P < 0.05. (C) Expression of phosphorylated STAT1 (P-STAT1) in DCs treated with anti-FcγRIIB antibody or isotype control antibody in serum-free medium compared with 1% plasma. Immature monocyte–derived DCs were treated with anti-FcγRIIB antibody (RIIB DC) or isotype control antibody (Iso DC) in serum-free medium or in medium supplemented with 1% human plasma. 24 h later, the expression of P-STAT1 was examined by flow cytometry. Data are representative of three similar experiments. Data represent the mean ± the SD.
Figure 4.
Figure 4.
Induction of IFN response by anti-FcγRIIB antibody is not inhibited by blocking antibodies against IFN-α and IFN-γ. (A) Up-regulation of P-STAT1 by exogenous IFN-α is blocked by antibodies against IFN-α. Monocyte-derived IDCs were either left untreated (DC−) or treated with IFN-α2b (1,000 U/ml intron A). The DCs were either treated with a combination of blocking antibodies against IFN-α, as well as IFNAR (αIFNAR; both at 10 μg/ml) or with their isotype control antibodies (Isotype; mouse IgG1 and mouse IgG2a, respectively; both at 10 μg/ml) for 45 min before treatment with IFN-α. The DCs were analyzed for their expression of P-STAT1 by flow cytometry. Gray area of the histogram shows staining of the DCs with isotype control (Mouse IgG2a) for P-STAT1 antibody. The graph represents one of two similar experiments. (B) Effect of blocking antibodies against IFN-α on anti-FcγRIIB–mediated induction of P-STAT1. Monocyte-derived IDCs were treated with anti-FcγRIIB antibody (5 μg/ml RIIB) or mouse IgG1 isotype control antibody (Iso). DCs treated with anti-FcγRIIB antibody were either treated with blocking antibodies against IFN-α and IFNAR (10 μg/ml RIIB + αIFNa+αIFNAR) or isotype control antibody (RIIB + Isotype; 10 μg/ml mouse IgG2a and 10 μg/ml IgG1, respectively) for 45 min before the addition of anti-FcγRIIB antibody. 24 h later, flow cytometry was performed to examine the expression of P-STAT1. Some DCs were also stained with mouse IgG2a, which is isotype control for the P-STAT1 antibody. One of two similar experiments. (C) Effect of anti-IFNAR blocking antibody on anti-FcγRIIB–mediated induction of P-STAT1. Freshly isolated PBMCs were treated with IFN-α2b (1,000 U/ml intron A) or anti-FcγRIIB antibody and an isotype control antibody either in the presence of 20 μg/ml IFNAR antibody (IFNAR Ab) or isotype control antibody (mouse IgG2a). 1 h later, flow cytometry was performed to examine the expression of P-STAT1 on CD14+ monocytes. Data shown are the summary of three similar experiments. *, P < 0.05. Data represent the mean ± the SD. (D) IFNγ blocking antibodies do not inhibit the up-regulation of P-STAT1 by anti-FcγRIIB antibody. IDCs were treated with either anti-FcγRIIB antibody (5 μg/ml RIIB) or isotype control antibody (Iso). DCs treated with anti-FcγRIIB antibody were either treated with blocking antibodies against IFNγ and IFNAR (10 μg/ml RIIB + αIFNγ) or isotype control antibody (10 μg/ml RIIB + Isotype; mouse IgG1) for 45 min before the addition of anti-FcγRIIB antibody. 24 h later, flow cytometry was performed to examine the expression of P-STAT1. Some DCs were also stained with mouse IgG2a, which is isotype control for the P-STAT1 antibody. The graph shows one of two similar experiments. (E) Anti-FcγRIIB induced up-regulation of P-STAT1 is rapid. Immature monocyte derived DCs (left) or monocytes (right) were treated with 10 μg/ml anti-FcγRIIB antibody (RIIB) or mouse IgG1 isotype control antibody (Iso). 1 h later flow cytometry was performed to detect the expression of P-STAT1. Gray histogram shows staining with mouse IgG2a isotype control antibody for P-STAT1. The graphs show one of five similar experiments.
Figure 5.
Figure 5.
Role of activating FcγRs in the FcR-mediated DC maturation and induction of P-STAT1. (A) Expression of FcγRI, RIIA, RIIB, and RIIIA on DCs generated from CD14+ monocytes by flow cytometry. Day 5 monocyte-derived IDCs were examined for the expression of FcγR1, FcγRIIA, FcγRIIB, and FcγRIII by flow cytometry. The area in gray represents staining with isotype control antibodies. Figure represents one of six similar experiments. (B) Down-regulation of anti-FcγRIIB antibody induced DC maturation by blocking antibodies against activating FcγR. IDCs (n = 4) were treated with isotype control antibody or anti-FcγRIIB antibody either with blocking antibodies against CD32A and CD16 antibody (αCD32A + αCD16; clone IV.3 and 3G8, both at 10 μg/ml) or their isotype control antibodies (Isotype; mouse IgG2a and IgG1, respectively). 24 h later, the expression of CD80 and CD83 was monitored by flow cytometry, and the double-positive cells were used to assess DC maturation. Change in maturation between isotype-treated and anti-FcγRIIB–treated DCs was considered as 100%. The figure shows the percentage of decrease in maturation of DCs treated with blocking antibodies against the activating FcγR (CD32A and CD16). Data are a summary of four similar experiments. *, P < 0.05. (C and D) Down-regulation of anti-FcγRIIB antibody induced P-STAT1 by blocking antibodies against activating FcγRs. IDCs (C) or PBMCs (D) were treated with mouse IgG1 isotype control antibody (Isotype) or anti-FcγRIIB antibody (RIIB). Some of the DCs and PBMCs treated with anti-FcγRIIB antibody were pretreated with blocking antibodies against CD32A and CD16 (αCD32A + αCD16; clone IV.3 and clone 3G8, respectively, both 10 μg/ml) or isotype control antibodies for the CD32A and CD16 blocking antibodies (mouse IgG2a and mouse IgG1, respectively; 10 μg/ml) for 45 min. Expression of P-STAT1 on CD11c+ DCs or CD14+ monocytes was examined by flow cytometry. Data are representative of four similar experiments for DCs and three for monocytes. (E) PBMCs were treated with MIgG1 isotype control antibody or anti-FcγRIIB antibody. Some of the anti-FcγRIIB–treated PBMCs were pretreated with blocking antibody to CD16 (3G8), CD32A (IV.3), or a combination of blocking antibodies against CD16 and CD32A (3G8 + IV.3) or their isotype control antibodies (mouse IgG1 and mouse IgG2a, respectively; Iso). 1 h later, the expression of P-STAT1 in CD14+ monocytes was analyzed by flow cytometry. The change in expression of P-STAT1 between MIgG1-treated cells and anti-FcγRIIB–treated cells was considered as 100%. The figure shows the percentage of decrease in this P-STAT1 phosphorylation by blocking antibodies against CD16 (αCD16) and CD32A (αCD32A), either alone or in combination (αCD16 + αCD32A). The histogram shows the summary of experiments on three separate donors (*, P < 0.05). (F) Inhibition of Syk tyrosine kinase abrogates anti-FcγRIIB induced up-regulation of P-STAT1. Immature Mo-DCs were treated with medium alone (medium) or Syk tyrosine kinase inhibitor piceatannol (PICE) at 5 μmol concentration. 30 min later, the DCs were treated with either anti-FcγRIIB antibody or isotype control mouse IgG1 antibody (MIgG1). 24 h later, the DCs were analyzed for their P-STAT1 expression and maturation (CD80 and CD83) by flow cytometry. Change in expression of P-STAT1, as well as maturation between MIgG1-treated cells and anti-FcγRIIB–treated cells, was considered as 100%. The histogram on the left shows the percentage of decrease in this P-STAT1 phosphorylation by piceatannol treatment. The histogram on the right shows the percentage of decrease in DC maturation by piceatannol treatment. The graphs are a summary of experiments on three separate donors (*, P < 0.05). Data represent the mean ± the SD.
Figure 6.
Figure 6.
FcγR-mediated DC maturation can be inhibited by STAT1 knockdown. (A) Day 4 IDCs were electroporated with 10 μg of STAT1 siRNA (STAT1) or nontargeting siRNA (Control). Some DCs were cultured without electroporation (No electr). The DCs were harvested 48 and 72 h after electroporation, and a Western blot was performed to detect total STAT1 protein. Data are representative of two separate experiments. (B and C) DCs were harvested 72 h after electroporation with either STAT1 siRNA or nontargeting control siRNA. Some nonelectroporated DCs were also harvested. The DCs were treated with anti-FcγRIIB antibody or isotype control antibody. Some of the DCs electroporated with STAT1 siRNA were also treated with the inflammatory cytokine cocktail. 24 h later, DC maturation was determined by examining the expression of CD80, CD83, and CD11c by flow cytometry. (B) Summary of data in four independent experiments (mean ± the SD; *, P < 0.05). (C) Data from a representative experiment.

Similar articles

Cited by

References

    1. Ravetch, J.V., and S. Bolland. 2001. IgG Fc receptors. Annu. Rev. Immunol. 19:275–290. - PubMed
    1. Dhodapkar, K.M., J.L. Kaufman, M. Ehlers, D.K. Banerjee, E. Bonvini, S. Koenig, R.M. Steinman, J.V. Ravetch, and M.V. Dhodapkar. 2005. Selective blockade of inhibitory Fc gamma receptor enables human dendritic cell maturation with IL-12p70 production and immunity to antibody- coated tumor cells. Proc. Natl. Acad. Sci. USA. 102:2910–2915. - PMC - PubMed
    1. Kalergis, A.M., and J.V. Ravetch. 2002. Inducing tumor immunity through the selective engagement of activating Fc receptors on dendritic cells. J. Exp. Med. 195:1653–1659. - PMC - PubMed
    1. Pestka, S., C.D. Krause, and M.R. Walter. 2004. Interferons, interferon-like cytokines, and their receptors. Immunol. Rev. 202:8–32. - PubMed
    1. Platanias, L.C. 2005. Mechanisms of type-I- and type-II-interferon- mediated signalling. Nat. Rev. Immunol. 5:375–386. - PubMed

Publication types

MeSH terms