. 2007 May 9;2(5):e439.
doi: 10.1371/journal.pone.0000439.

On the dynamics of the spontaneous activity in neuronal networks

Affiliations

On the dynamics of the spontaneous activity in neuronal networks

Alberto Mazzoni et al. PLoS One. .

Abstract

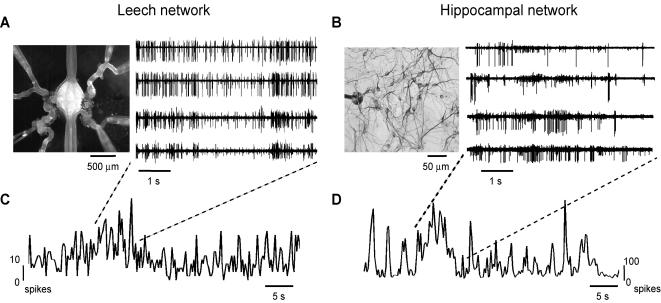
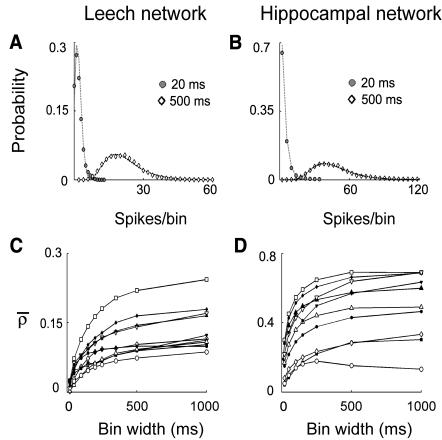
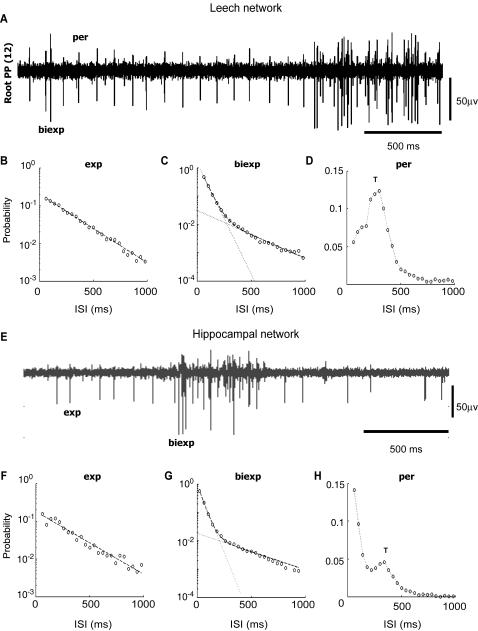
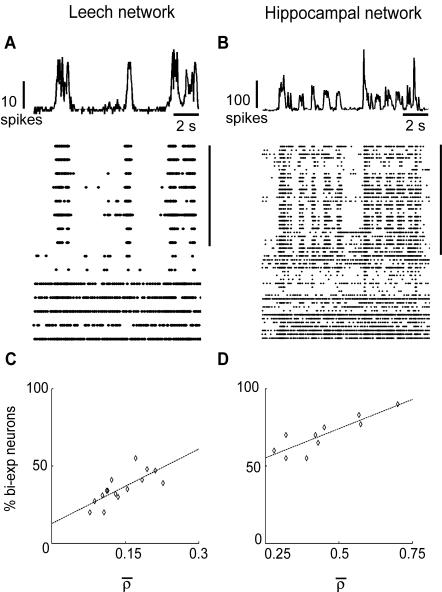
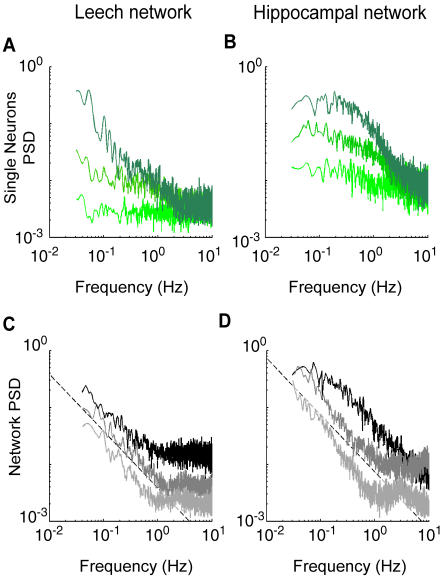
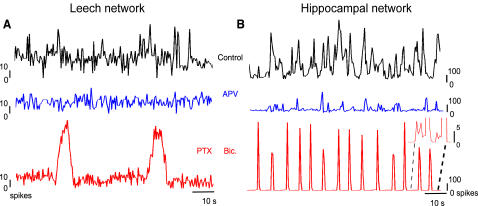
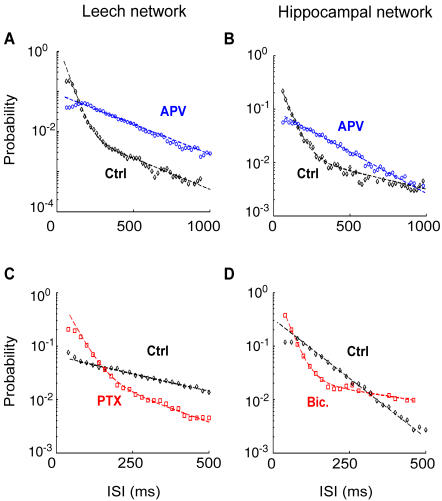
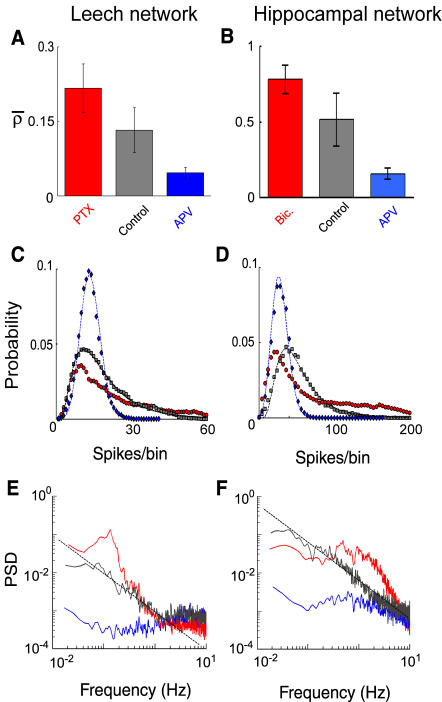
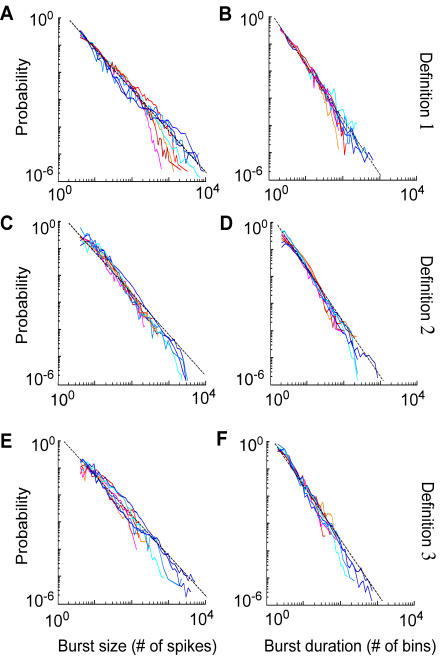
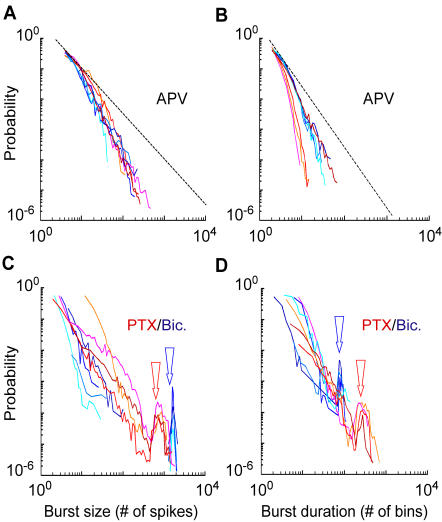
Most neuronal networks, even in the absence of external stimuli, produce spontaneous bursts of spikes separated by periods of reduced activity. The origin and functional role of these neuronal events are still unclear. The present work shows that the spontaneous activity of two very different networks, intact leech ganglia and dissociated cultures of rat hippocampal neurons, share several features. Indeed, in both networks: i) the inter-spike intervals distribution of the spontaneous firing of single neurons is either regular or periodic or bursting, with the fraction of bursting neurons depending on the network activity; ii) bursts of spontaneous spikes have the same broad distributions of size and duration; iii) the degree of correlated activity increases with the bin width, and the power spectrum of the network firing rate has a 1/f behavior at low frequencies, indicating the existence of long-range temporal correlations; iv) the activity of excitatory synaptic pathways mediated by NMDA receptors is necessary for the onset of the long-range correlations and for the presence of large bursts; v) blockage of inhibitory synaptic pathways mediated by GABA(A) receptors causes instead an increase in the correlation among neurons and leads to a burst distribution composed only of very small and very large bursts. These results suggest that the spontaneous electrical activity in neuronal networks with different architectures and functions can have very similar properties and common dynamics.


Conflict of interest statement

Competing Interests: The authors have declared that no competing interests exist.

Figures

Figure 1
Figure 1. Spontaneous bursting activity in the leech and hippocampal networks.
(A) Left: isolated leech ganglion with eight suction pipettes recording from different roots. Right: Extracellular recordings showing the spontaneous electrical activity monitored from four different roots. (B) Left: close-up of dissociated hippocampal neurons grown on MEA. The black dot corresponds to an individual electrode. Right: spontaneous activity recorded from four extracellular electrodes (out of 60). (C–D) Network firing rate binned at 500 ms for a representative leech network (C) and a representative hippocampal network (D). Note the presence of large peaks corresponding to concerted bursts of electrical activity and the difference between the two spike scales.
Figure 2
Figure 2. Network firing correlation.
(A–B) Spikes per bin distribution of the network firing rate binned at 20 ms (filled symbols) and 500 ms (open symbols), in leech (A) and hippocampal networks (B). Data binned at 20 ms are fitted by a Poisson distribution. Data binned at 500 ms are fitted by a lognormal distribution. (C–D) Network correlation coefficient ρ̅ as a function of the bin width for 10 leech (C) and 10 hippocampal networks (D) showing a bin width-dependent growth. Each symbol corresponds to a different preparation.
Figure 3
Figure 3. Single neurons dynamics.
(A and E) Extracellular recording from a single electrode in the leech (A) and in the hippocampal network (E) showing the activity of neurons with periodic (A), Poissonian (E) and bursting (A and E) firing. (B and F) ISI distribution of identified neurons with exponential dynamics for leech (B) and hippocampal (F) network. Black dashed lines indicate exponential fit. (C and G) ISI distribution of identified neurons with bi-exponential dynamics for leech (C) and hippocampal (G) network. Black dashed lines indicate bi-exponential fit. (D and H) ISI distribution of identified neurons with periodic dynamics for leech (D) and hippocampal (G) network. Label T indicates the position of the peak, corresponding to the period of the firing.
Figure 4
Figure 4. Single neurons dynamics and network bursts.
(A–B) Network firing rate (upper panel) and raster plot (lower panel) for leech (A) and hippocampal (B) network. Each line of the raster plot represents the activity of a single neuron. Bi-exponential neurons have been clustered and are indicated by the black vertical bar. (C–D) Fraction of neurons displaying bi-exponential ISI distribution as a function of the network correlation coefficient for leech (C) and hippocampal networks (D). Each point represents a different experiment. Black dashed lines indicate linear regression.
Figure 5
Figure 5. Single neurons and network frequency analysis.
(A–B) Power spectral density (PSD) of representative neurons in different green shades from leech (A) and hippocampal networks (B). The PSD of the firing of a single neuron ranges from an almost flat behavior to very high power associated to low frequencies. (C–D) PSD of the network firing rate for representative experiments from leech (C) and hippocampal networks (D). Black dashed lines correspond to 1/f slope, describing the PSD for frequencies smaller than 1 Hz. In both panels, higher and lower traces are vertically shifted for clarity, by factors 1.2 and 0.8 respectively.
Figure 6
Figure 6. Effects of synaptic blockers on the network activity.
(A–B) Changes in the network firing rates binned at 500 ms for leech (A) and hippocampal (B) networks, in control (black trace), in the presence of 20 µM APV (blue trace) and 10 µM PTX (red trace, panel A) or bicuculline (red trace, panel B). Note the residual spiking activity between periods of synchronous activity in the hippocampal network (inset, right red trace; large peaks have been truncated for clarity).
Figure 7
Figure 7. Effects of synaptic blockers on single neurons dynamics.
(A–B) Neurons from leech (A) and hippocampal (B) networks, having a bi-exponential ISI distribution in control (black trace), and an exponential ISI distribution in the presence of 20 µM APV (blue trace). (C–D) Neurons from leech (C) and hippocampal (D) networks, having an exponential ISI distribution in control (black trace), and a bi-exponential ISI distribution in the presence of 10 µM PTX (red trace, panel C) or bicuculline (red trace, panel D).
Figure 8
Figure 8. Effects of synaptic blockers on network correlation.
(A–B) Network correlation coefficient rate in leech (A) and hippocampal (B) networks in the different pharmacological conditions considered. (C–D) Spikes per bin distribution of the network firing rate in leech (C) and hippocampal (D) networks. Data were fitted by a lognormal function in normal conditions (grey symbols). In the presence of 20 µM APV (blue symbols) data were fitted by a Poisson distribution for the leech network and by a lognormal distribution for the hippocampal network. Note the reduction of skewness in the presence of APV in both preparations (see text). Red symbols correspond to spike per bin distribution in the presence of 10 µM PTX (C) and bicuculline (D). (E–F) PSD of the network firing rate in control (black trace), in the presence of APV (blue trace), PTX (E, red trace) or bicuculline (F, red trace). Black dashed lines have 1/f slope.
Figure 9
Figure 9. Burst statistics.
Probability distributions of burst size and duration computed according to 3 different burst definitions. Data from representative experiments obtained in leech (reddish lines) and hippocampal networks (bluish lines). Bursts size (on the left) and duration (on the right) distributions are calculated according to definition 1 (A, B), definition 2 (C, D), and definition 3 (E, F). Black dashed lines are power laws with a slope of −1.5 in the left column and −2 in the right column. Note the power law behavior of bursts size distribution of hippocampal networks for 3 log units.
Figure 10
Figure 10. Bursts statistics in the presence of synaptic blockers.
Bursts size and duration distributions for leech (reddish lines) and hippocampal (bluish lines) networks obtained using burst definition 1. (A–B) In the presence of APV, the number of large bursts decreased. The black dashed line has a slope of −1.5 in (A) and of −2 in (B), as in the right and left column of Figure 9, respectively. (C–D) In the presence of GABAA receptor blockers (PTX/bicuculline), peaks corresponding to large bursts appeared (indicated by the arrows). Traces were shifted to superimpose peaks of each preparation. In hippocampal networks, intermediate size bursts are absent as shown by the discontinuity of the distributions.

Similar articles

Cited by

References

    1. Raichle M. The brain dark energy. Science. 2006;314:1249–1250. - PubMed
    1. Marder E, Calabrese RL. Principles of rhythmic motor pattern generation. Physiol Rev. 1996;76:687–717. - PubMed
    1. Calabrese RL, Nadim F, Olsen OH. Heartbeat control in the medicinal leech: a model system for understanding the origin, coordination and modulation of rhythmic motor patterns. J Neurobiol. 1995;27:390–402. - PubMed
    1. Bianchi AL, Denavit Saubie M, Champagnat J. Central control of breathing in mammals: neuronal circuitry, membrane properties, and neurotransmitters. J Am Phys Soc. 1995;75:1–4. - PubMed
    1. Kristan WB, Jr, Calabrese RI, Friesen WO. Neuronal control of leech behavior. Prog Neurobiol. 2005;76:279–327. - PubMed

Publication types