

Analysis of reflex modulation with a biologically realistic neural network
- PMID: 17503169
- PMCID: PMC2799624
- DOI: 10.1007/s10827-007-0037-7
Analysis of reflex modulation with a biologically realistic neural network
Abstract
In this study, a neuromusculoskeletal model was built to give insight into the mechanisms behind the modulation of reflexive feedback strength as experimentally identified in the human shoulder joint. The model is an integration of a biologically realistic neural network consisting of motoneurons and interneurons, modeling 12 populations of spinal neurons, and a one degree-of-freedom musculoskeletal model, including proprioceptors. The model could mimic the findings of human postural experiments, using presynaptic inhibition of the Ia afferents to modulate the feedback gains. In a pathological case, disabling one specific neural connection between the inhibitory interneurons and the motoneurons could mimic the experimental findings in complex regional pain syndrome patients. It is concluded that the model is a valuable tool to gain insight into the spinal contributions to human motor control. Applications lay in the fields of human motor control and neurological disorders, where hypotheses on motor dysfunction can be tested, like spasticity, clonus, and tremor.
Figures
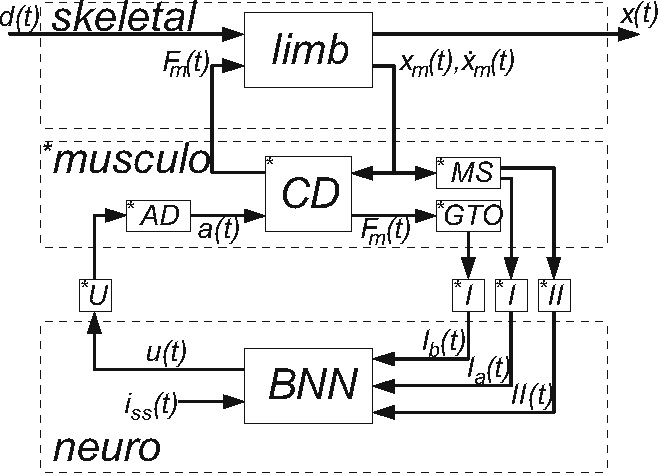
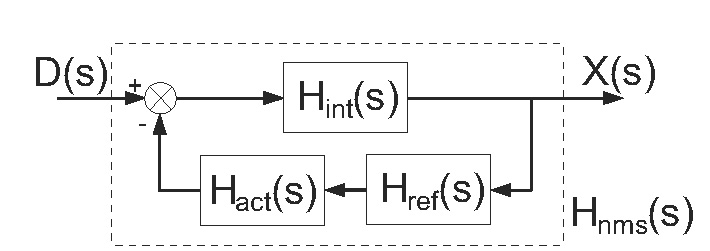
 : muscle stretch velocity; u(t): motoneuron activation. The muscle spindles (MS) and Golgi tendon organs (GTO) sense the muscle stretch, stretch velocity and force resulting in afferent signals on the Ia(t), Ib(t), and II(t) afferents respectively. These afferent signals have a conduction time τI or τII, depending on the afferent path, before reaching the BNN. After the conduction time τu(t), u(t) reaches the muscle and is converted into the muscle activation a(t) by the activation dynamics (AD). An asterisk (*) denotes the necessity to double the components for the flexor and the extensor muscles
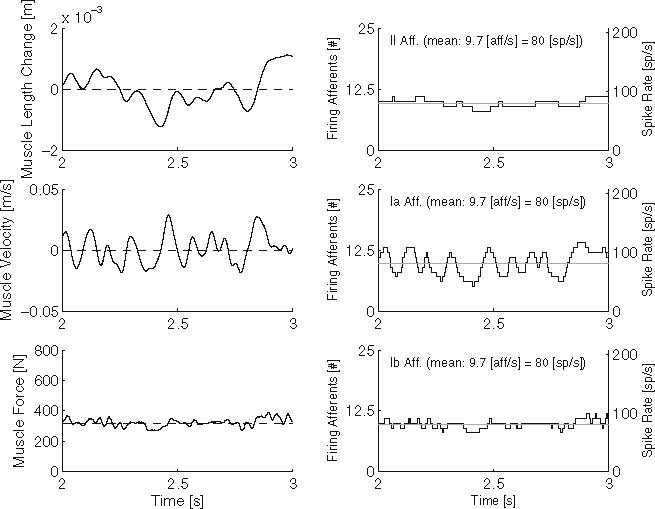
 (below). Monosynaptic stretch reflex synaptic strengths of 0 (dots), 1.5 (pluses) and 3 (‘x’-marks) times the default synaptic strength, simulating decreasing presynaptic inhibition on this synapse. Solid line: simulation; dotted line: linear model fit; and dashed line: simulation without afferent feedback
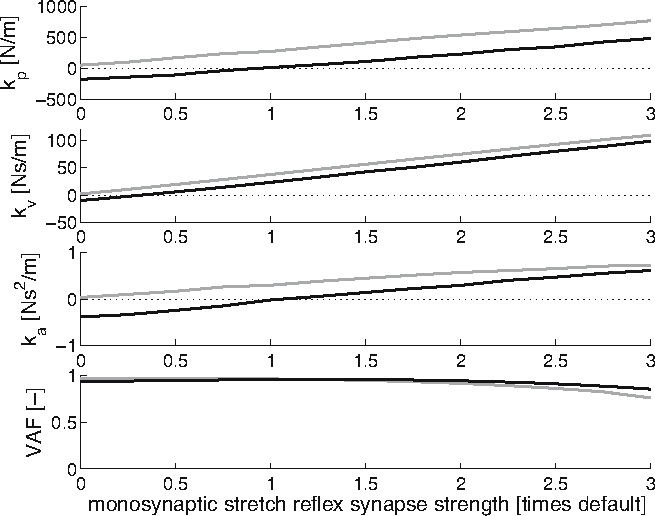
Similar articles
-
Quantifying proprioceptive reflexes during position control of the human arm.IEEE Trans Biomed Eng. 2008 Jan;55(1):311-21. doi: 10.1109/TBME.2007.899298. IEEE Trans Biomed Eng. 2008. PMID: 18232375
-
Relating reflex gain modulation in posture control to underlying neural network properties using a neuromusculoskeletal model.J Comput Neurosci. 2011 Jun;30(3):555-65. doi: 10.1007/s10827-010-0278-8. Epub 2010 Sep 24. J Comput Neurosci. 2011. PMID: 20865310 Free PMC article.
-
Modeling movement disorders--CRPS-related dystonia explained by abnormal proprioceptive reflexes.J Biomech. 2012 Jan 3;45(1):90-8. doi: 10.1016/j.jbiomech.2011.09.024. Epub 2011 Nov 21. J Biomech. 2012. PMID: 22112920
-
Modulation by corticospinal volleys of presynaptic inhibition to Ia afferents in man.J Physiol Paris. 1999 Sep-Oct;93(4):387-94. doi: 10.1016/s0928-4257(00)80066-2. J Physiol Paris. 1999. PMID: 10574127 Review.
-
The lower limb flexion reflex in humans.Prog Neurobiol. 2005 Dec;77(6):353-95. doi: 10.1016/j.pneurobio.2005.11.003. Epub 2005 Dec 28. Prog Neurobiol. 2005. PMID: 16386347 Review.
Cited by
-
Neuromusculoskeletal modeling of spasticity: A scoping review.PLoS One. 2025 May 14;20(5):e0320153. doi: 10.1371/journal.pone.0320153. eCollection 2025. PLoS One. 2025. PMID: 40367071 Free PMC article.
-
Role and modulation of various spinal pathways for human upper limb control in different gravity conditions.PLoS Comput Biol. 2025 Jan 6;21(1):e1012069. doi: 10.1371/journal.pcbi.1012069. eCollection 2025 Jan. PLoS Comput Biol. 2025. PMID: 39761279 Free PMC article.
-
Personalized neuromusculoskeletal modeling to improve treatment of mobility impairments: a perspective from European research sites.J Neuroeng Rehabil. 2012 Mar 30;9:18. doi: 10.1186/1743-0003-9-18. J Neuroeng Rehabil. 2012. PMID: 22463378 Free PMC article.
-
Spinal mechanisms may provide a combination of intermittent and continuous control of human posture: predictions from a biologically based neuromusculoskeletal model.PLoS Comput Biol. 2014 Nov 13;10(11):e1003944. doi: 10.1371/journal.pcbi.1003944. eCollection 2014 Nov. PLoS Comput Biol. 2014. PMID: 25393548 Free PMC article.
-
Experimental and Computational Study on Motor Control and Recovery After Stroke: Toward a Constructive Loop Between Experimental and Virtual Embodied Neuroscience.Front Syst Neurosci. 2020 Jul 7;14:31. doi: 10.3389/fnsys.2020.00031. eCollection 2020. Front Syst Neurosci. 2020. PMID: 32733210 Free PMC article.
References
-
- Abbink, D. A. (2002). The effect of position and force tasks on human arm admittance. MSc-thesis, Delft University of Technology, Delft, The Netherlands.
-
- {'text': '', 'ref_index': 1, 'ids': [{'type': 'DOI', 'value': '10.1007/s004220050421', 'is_inner': False, 'url': 'https://doi.org/10.1007/s004220050421'}, {'type': 'PubMed', 'value': '9525039', 'is_inner': True, 'url': 'https://pubmed.ncbi.nlm.nih.gov/9525039/'}]}
- Bashor, D. P. (1998). A large-scale model of some spinal reflex circuits. Biological Cybernetics, 78, 147–157. - PubMed
-
- {'text': '', 'ref_index': 1, 'ids': [{'type': 'DOI', 'value': '10.1093/brain/116.4.843', 'is_inner': False, 'url': 'https://doi.org/10.1093/brain/116.4.843'}, {'type': 'PubMed', 'value': '8353711', 'is_inner': True, 'url': 'https://pubmed.ncbi.nlm.nih.gov/8353711/'}]}
- Bhatia, K. P., Bhatt, M. H., & Marsden, C. D. (1993). The causalgia-dystonia syndrome. Brain, 116, 843–851. - PubMed
-
- {'text': '', 'ref_index': 1, 'ids': [{'type': 'PubMed', 'value': '7108572', 'is_inner': True, 'url': 'https://pubmed.ncbi.nlm.nih.gov/7108572/'}]}
- Crago, P. E., Houk, J. C., & Rymer, W. Z. (1982). TSampling of total muscle force by tendon organs. Journal of Neurophysiology, 47, 1069–1083. - PubMed
-
- {'text': '', 'ref_index': 1, 'ids': [{'type': 'DOI', 'value': '10.1007/PL00007980', 'is_inner': False, 'url': 'https://doi.org/10.1007/pl00007980'}, {'type': 'PubMed', 'value': '11205350', 'is_inner': True, 'url': 'https://pubmed.ncbi.nlm.nih.gov/11205350/'}]}
- De Vlugt, E., Van der Helm, F. C. T., Schouten, AC., & Brouwn, G. G. (2001). Analysis of the reflexive feedback control loop during posture maintenance. Biological Cybernetics, 84, 133–141. - PubMed
Publication types
MeSH terms
Substances
LinkOut - more resources
Full Text Sources
Other Literature Sources
